

Question: Could you please show me how to do these problems? Chapters 1 and 2: Marginal Analysis; Demand, Supply, and Equilibrium Prices A. Marginal Analysis Application
Could you please show me how to do these problems?
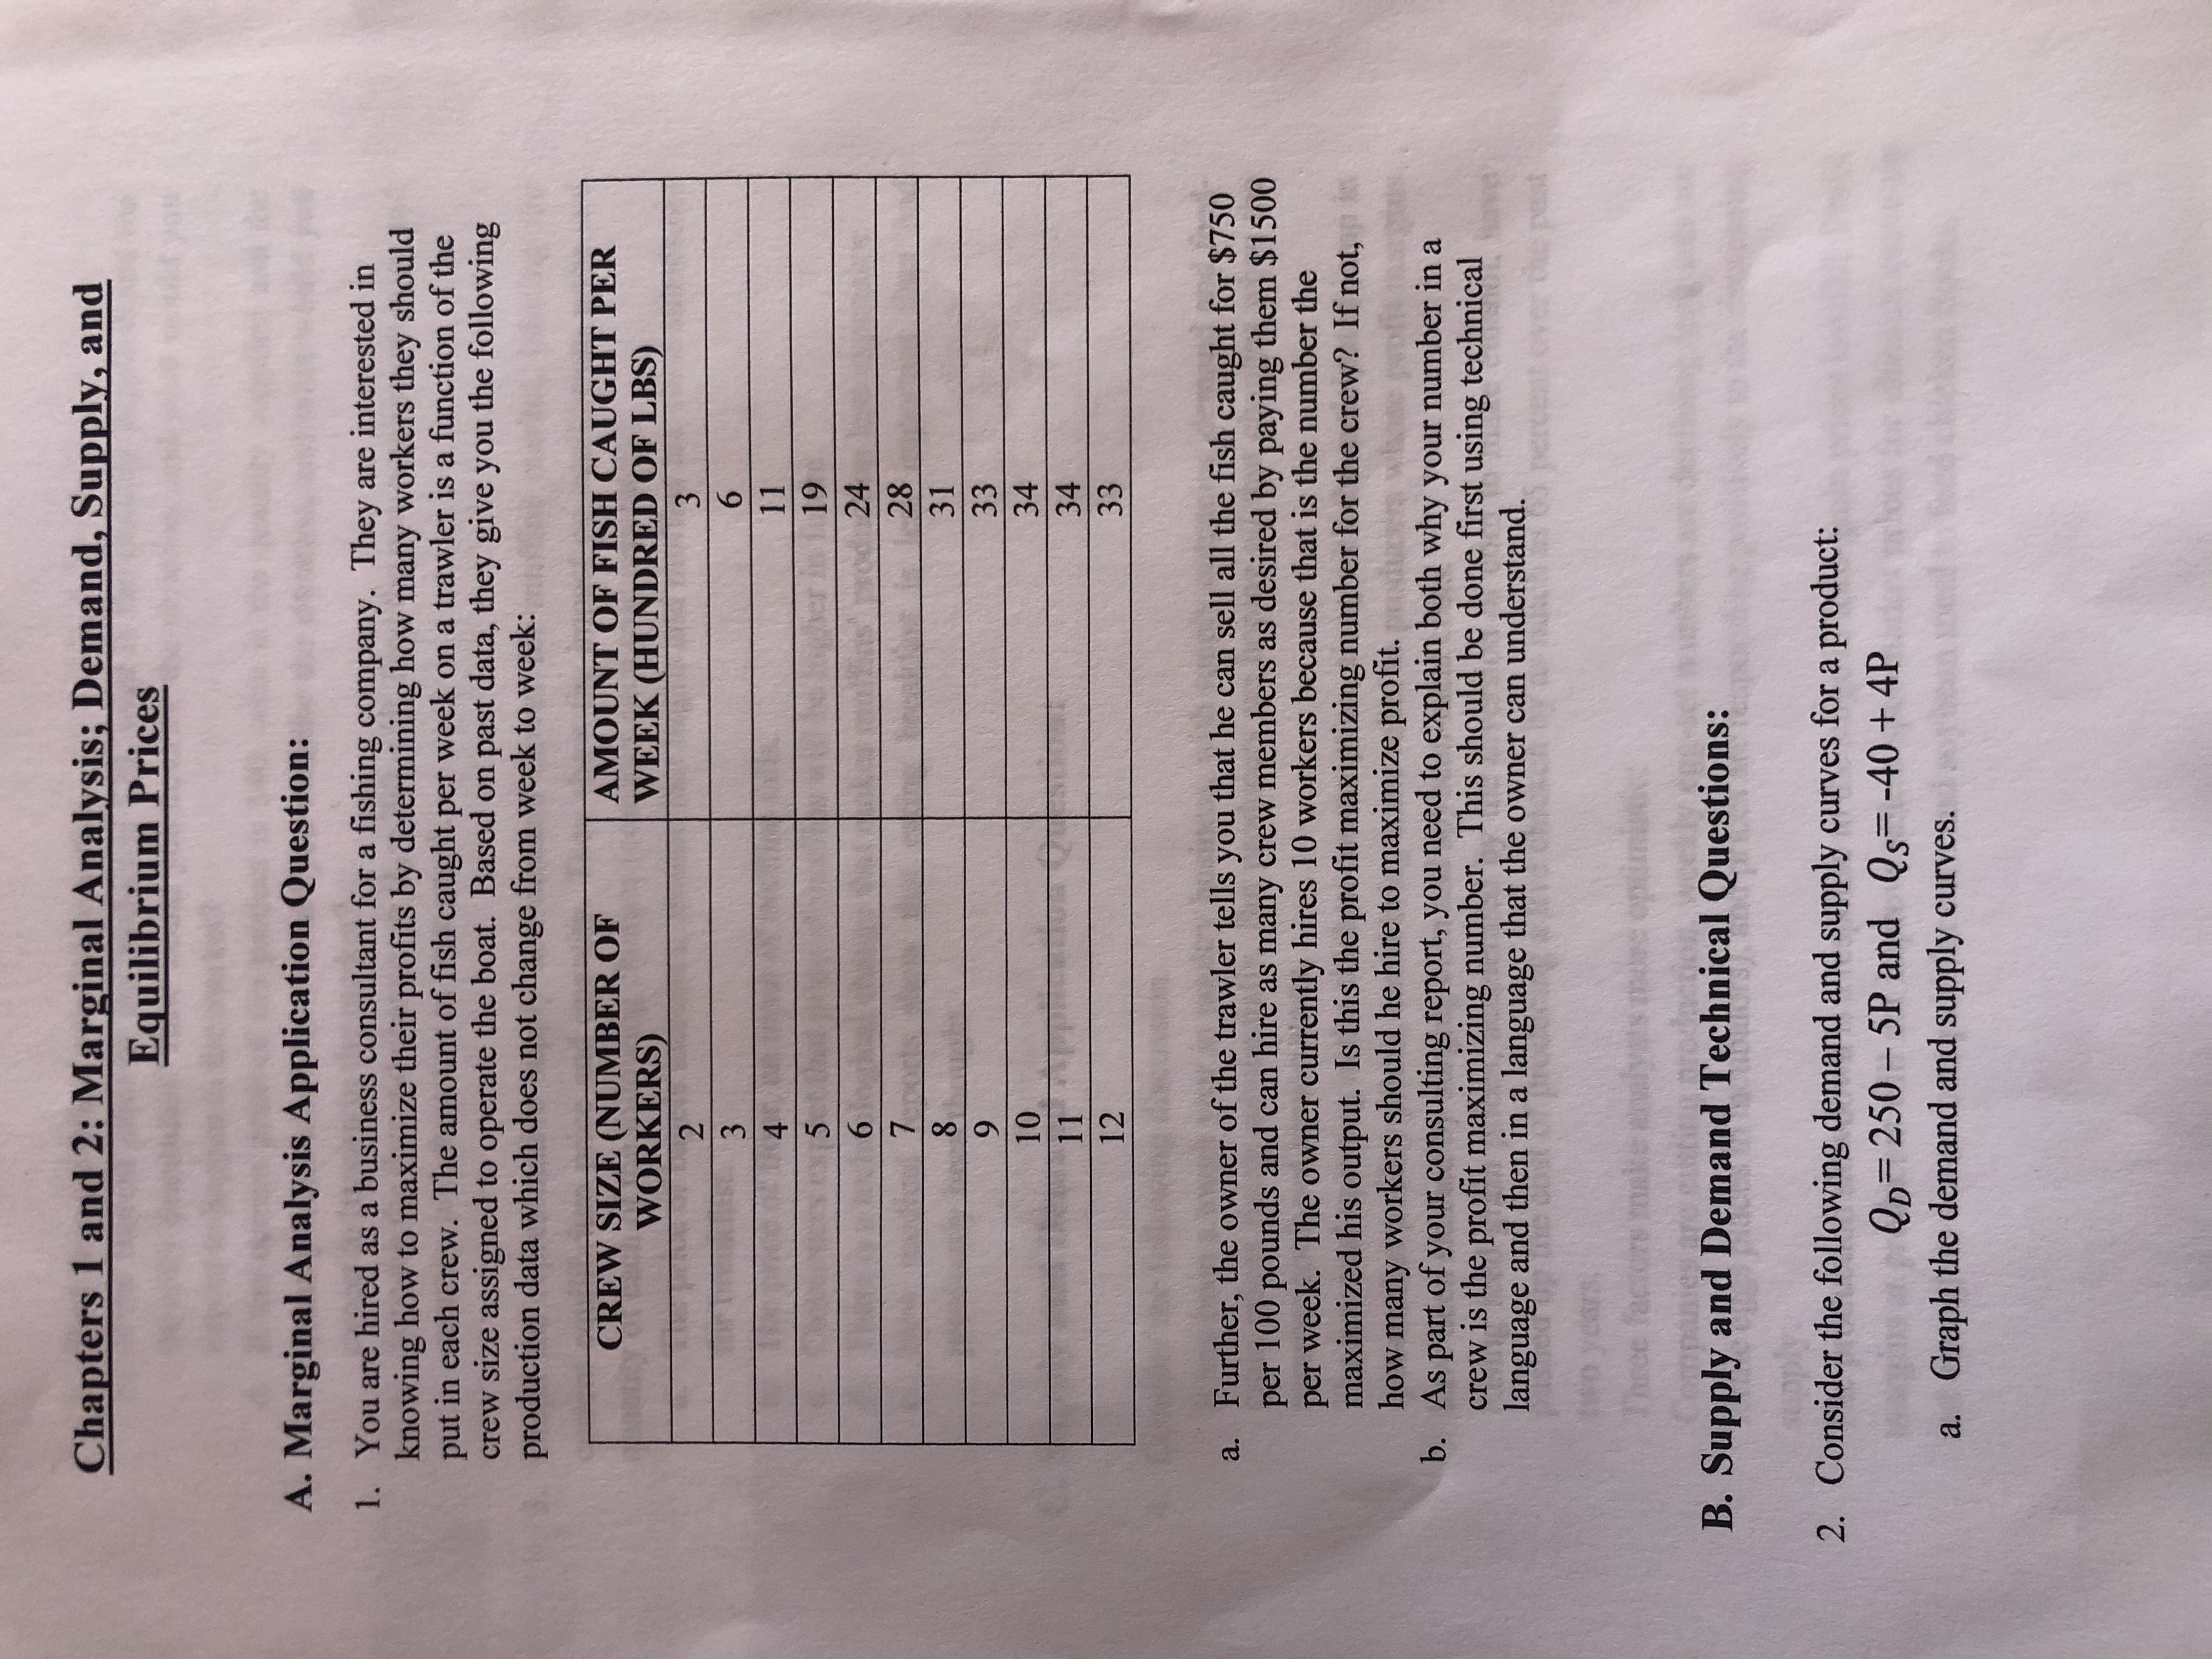

Chapters 1 and 2: Marginal Analysis; Demand, Supply, and Equilibrium Prices A. Marginal Analysis Application Question: 1. You are hired as a business consultant for a fishing company. They are interested in knowing how to maximize their profits by determining how many workers they should put in each crew. The amount of fish caught per week on a trawler is a function of the crew size assigned to operate the boat. Based on past data, they give you the following production data which does not change from week to week: CREW SIZE (NUMBER OF AMOUNT OF FISH CAUGHT PER WORKERS WEEK (HUNDRED OF LBS) 2 3 6 4 11 5 19 6 24 7 28 8 31 9 33 10 34 11 34 12 33 a. Further, the owner of the trawler tells you that he can sell all the fish caught for $750 per 100 pounds and can hire as many crew members as desired by paying them $1500 per week. The owner currently hires 10 workers because that is the number the maximized his output. Is this the profit maximizing number for the crew? If not, how many workers should he hire to maximize profit. b. As part of your consulting report, you need to explain both why your number in a crew is the profit maximizing number. This should be done first using technical language and then in a language that the owner can understand. two years. Three factors raise B. Supply and Demand Technical Questions: 2. Consider the following demand and supply curves for a product: QD= 250 - 5P and Qs=-40 + 4P a. Graph the demand and supply curves.b. Find the equilibrium price and quantity. have helped c. If the current price of the product is $20, what is the quantity supplied and the quantity demanded? How would you describe the situation, and what would you expect to happen in the market? d. If the current price of the product is $40, what is the quantity supplied and the quantity demanded? How would you describe the situation, and what would you expect to happen in the market? e. Suppose the demand changes to QD= 300 - 5P. Find the new equilibrium price and quantity, and show this in your graph. 3. Graph the representative supply and demand curves for muffins market, labeling the current equilibrium price and quantity. Then show the impact on equilibrium price and quantity of each of the following changes (consider each case separately): a. The price of bagels increases, assume that bagels and muffins are close substitutes for breakfast. b. The price of flour, an input of muffins falls. c. Consumers expect that price of muffins will be higher in future. d. There is a technological change that makes muffins' production less expensive. e. New medical reports show that eating breakfast is less important than had previously been thought. C. Supply and Demand Application Question: 4. Consider the following discussion. It has been a tough year in poultry business, with supply outpacing demand and feed- grain prices rising substantially. But producers are hoping all that changes when the summer cook-out season starts. The seasonal upswing in the chicken consumption, along with the anticipated jump in spot-market poultry prices, could bring some relief to producers whose profit margins have been slashed by surging corn and soybean-meal costs. Rising feed-grain prices, accelerated by the diversion of corn to make ethanol, have pushed up the cost of producing a live chicken by as much as 65 percent over the past two years. Three factors make analysts more optimistic: Companies are cutting production, weekly egg-set numbers are declining (egg sets are fertile eggs places in incubators), and prices are responding positively to the decreasing supply. The production slowdown is a response to the surge in feed-grain prices last fall. Profit margins at producers will not improve unless spot-market prices for chicken move up fast enough to cover costs paid for corn and soybean meal to feed chicken flocks.Production cutbacks and seasonal demand have helped fuel a 20-cent increase in boneless, skin-less breast meat prices to $1.46 a pound. Prices are expected to reach at least $1.80 by summer 2008. a. Use demand and supply analysis to illustrate the changes in chicken prices described in the article above. b. Describe what has happened in the corn and soybean-meal markets and how that has influenced the chicken market
Step by Step Solution
There are 3 Steps involved in it

Get step-by-step solutions from verified subject matter experts