

Question: Could you review my work? It will help me understand what needs to be fixed. 1. Read through the first sentence of each paragraph: .
Could you review my work? It will help me understand what needs to be fixed.
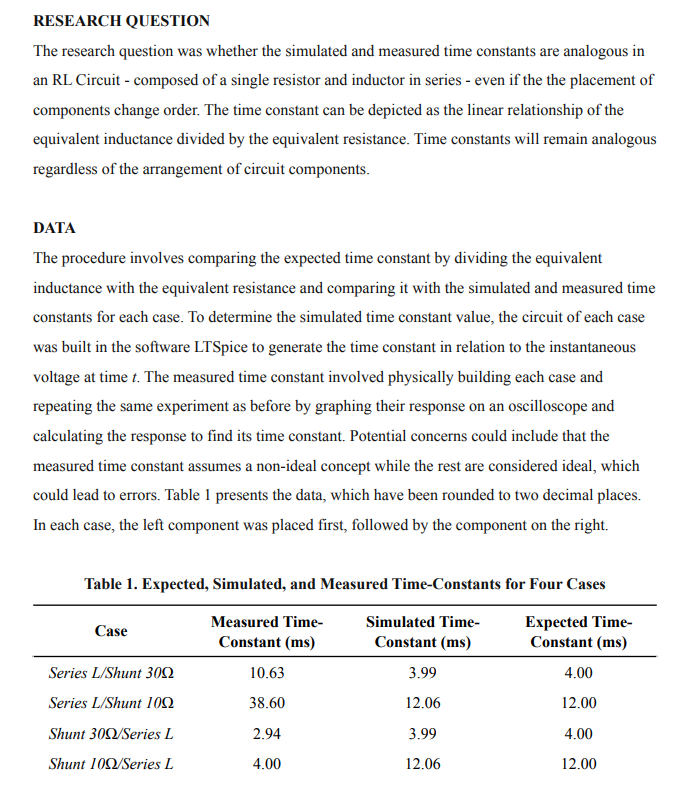
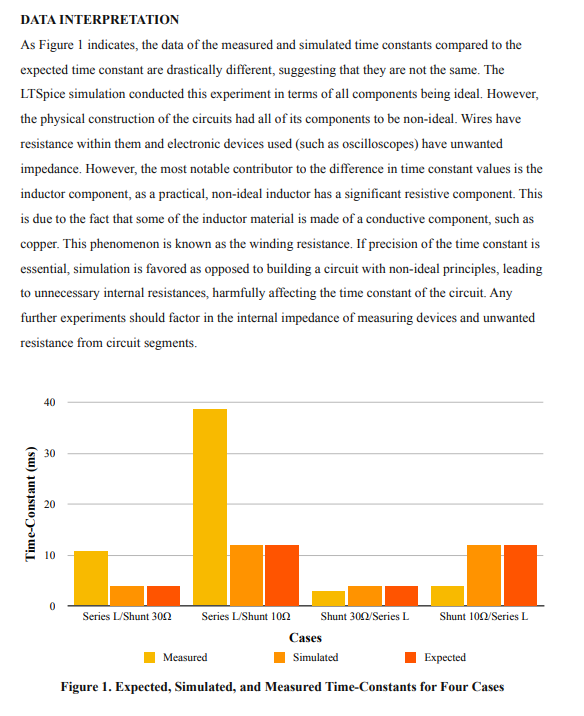
1. Read through the first sentence of each paragraph: . Paragraph 1: Does it identify a research question? . Paragraph 2: Does it identify the data (what they are and/or how they were obtained)? . Paragraph 3: Does it answer the research question? If the answer is no to any, identify an existing sentence that does provide that information, suggest a topic sentence, or at least let the author know a topic sentence is needed. 2. Read through the first paragraph: . Is the research question clear? (Do you understand what they are looking for, or is it just a statement of a general topic?) . Do you understand the premise and/or underlying hypothesis for the question? . What could the author add to make it clearer? Provide answers to this last question, using the first two to help generate ideas. You can also point out where they have provided good information that answers your questions. 3. Read through the second paragraph: . Is the source for the data clear? (This can include a brief explanation of method for data the author generated themselves.) . Does the choice of data make sense, given the question? Are there other data, or sources, that would better answer the question? Does the author address any of these shortcomings (or others) to the data? . What could the author change or add to make it clearer or more convincing? Provide answers to this last question, using the first two to help generate ideas. You can also point out where they have provided good information that answers your questions. 4. Read through the third paragraph: . Does it answer the research question clearly? (It need not be definitive to be clear) . Do the data support those conclusions? . Does the author address other possible interpretations, or the potential arguments against their own conclusions? . Do they suggest further work to address those concerns or other open questions? . What can the author do to provide stronger analysis here? Provide your answer to this last question, using the other questions to help generate ideas. 5. Look at the table and figure, and provide feedback on the following: . Formatting (ECE Style) . Design, including visual layout, labeling, and clarity (based on the lecture videos) . Choice of graphRESEARCH QUESTION The research question was whether the simulated and measured time constants are analogous in an RL Circuit - composed of a single resistor and inductor in series - even if the the placement of components change order. The time constant can be depicted as the linear relationship of the equivalent inductance divided by the equivalent resistance. Time constants will remain analogous regardless of the arrangement of circuit components. DATA The procedure involves comparing the expected time constant by dividing the equivalent inductance with the equivalent resistance and comparing it with the simulated and measured time constants for each case. To determine the simulated time constant value, the circuit of each case was built in the software LTSpice to generate the time constant in relation to the instantaneous voltage at time . The measured time constant involved physically building each case and repeating the same experiment as before by graphing their response on an oscilloscope and calculating the response to find its time constant. Potential concerns could include that the measured time constant assumes a non-ideal concept while the rest are considered ideal, which could lead to errors. Table 1 presents the data, which have been rounded to two decimal places. In each case, the left component was placed first, followed by the component on the right. Table 1. Expected, Simulated, and Measured Time-Constants for Four Cases Case Measured Time- Simulated Time- Expected Time- Constant (ms) Constant (ms) Constant (ms) Series L/Shunt 300 10.63 3.99 4.00 Series L/Shunt 100 38.60 12.06 12.00 Shunt 300/Series L 2.94 3.99 4.00 Shunt 100/Series L 4.00 12.06 12.00DATA INTERPRETATION As Figure 1 indicates, the data of the measured and simulated time constants compared to the expected time constant are drastically different, suggesting that they are not the same. The LTSpice simulation conducted this experiment in terms of all components being ideal. However, the physical construction of the circuits had all of its components to be non-ideal. Wires have resistance within them and electronic devices used (such as oscilloscopes) have unwanted impedance. However, the most notable contributor to the difference in time constant values is the inductor component, as a practical, non-ideal inductor has a significant resistive component. This is due to the fact that some of the inductor material is made of a conductive component, such as copper. This phenomenon is known as the winding resistance. If precision of the time constant is essential, simulation is favored as opposed to building a circuit with non-ideal principles, leading to unnecessary internal resistances, harmfully affecting the time constant of the circuit. Any further experiments should factor in the internal impedance of measuring devices and unwanted resistance from circuit segments. 40 30 Time-Constant (ms) 20 10 0 Series L/Shunt 300 Series L/Shunt 100 Shunt 301/Series L Shunt 101/Series L Cases Measured Simulated Expected Figure 1. Expected, Simulated, and Measured Time-Constants for Four Cases
Step by Step Solution
There are 3 Steps involved in it

Get step-by-step solutions from verified subject matter experts