

Question: Could you solve wrong places with explanation. tx Comparative financial statements for Pharoah and Flounder Ltd. are shown below. PHAROAH AND FLOUNDER LTD. Income Statement
Could you solve wrong places with explanation. tx
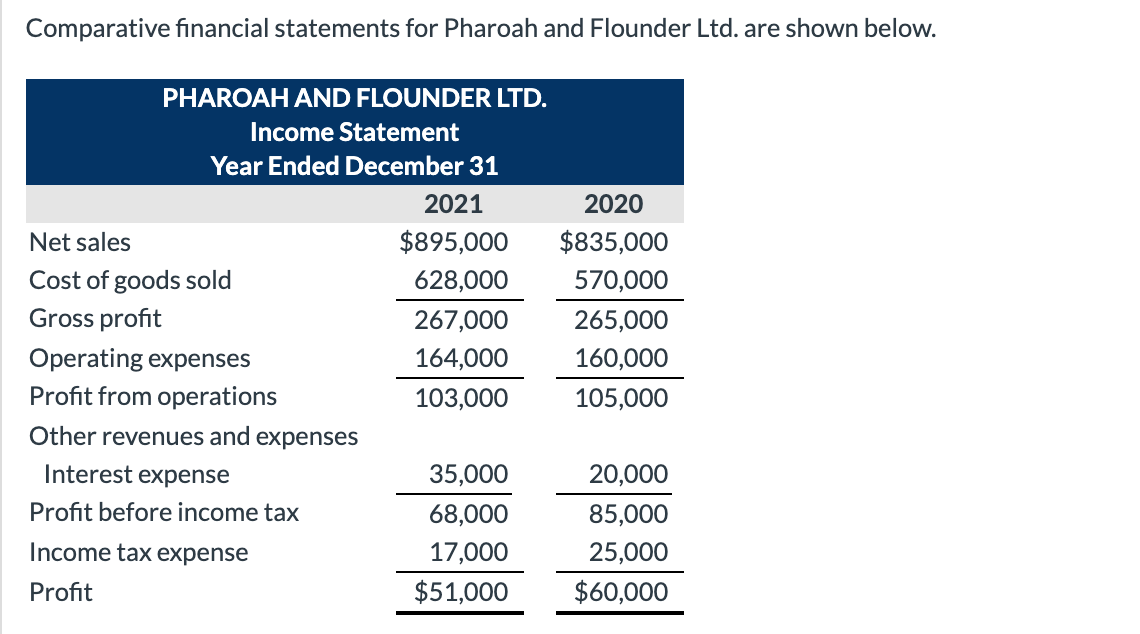
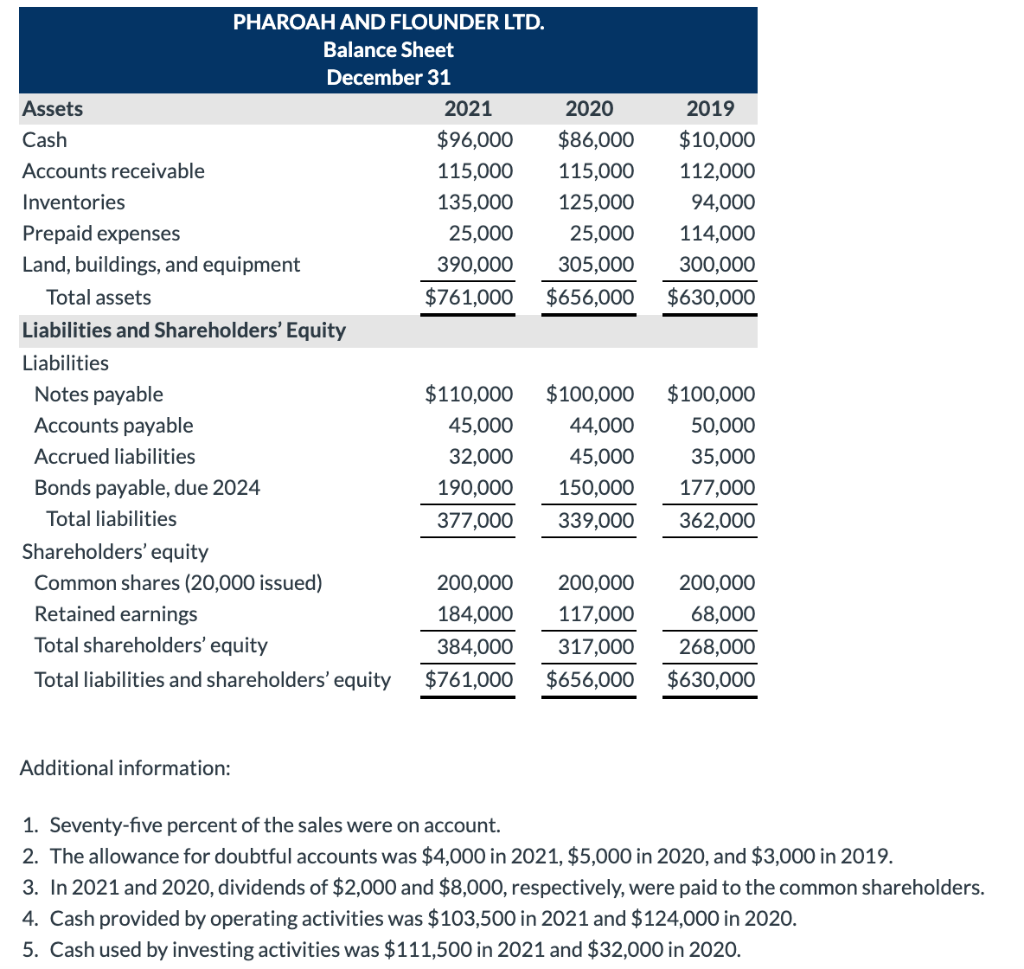
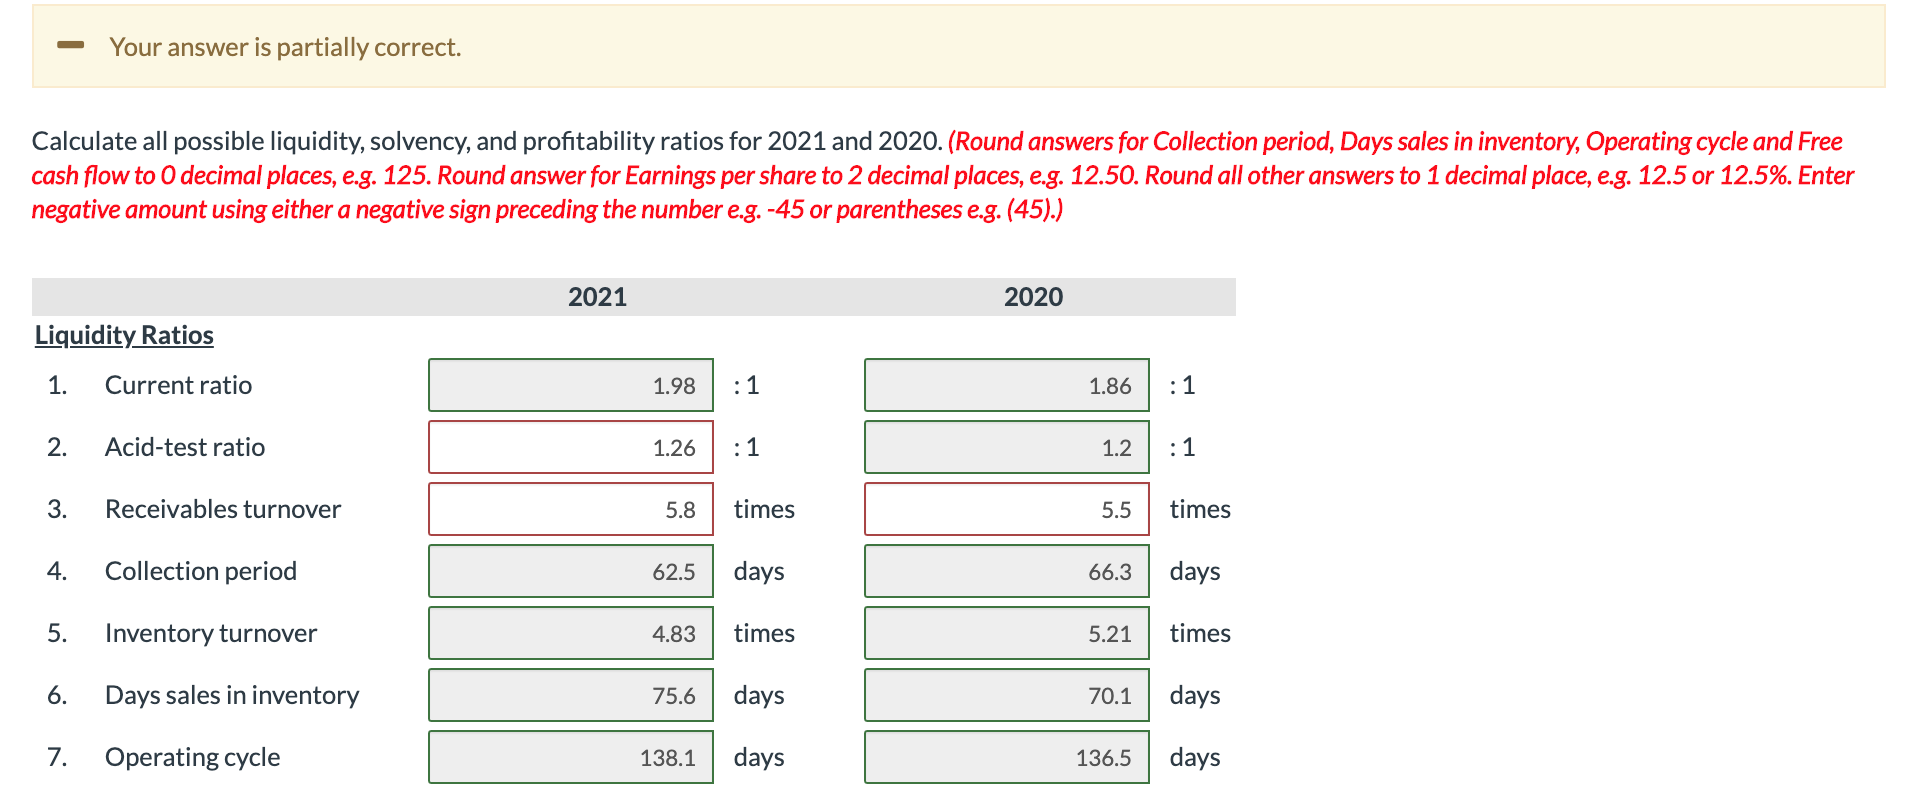
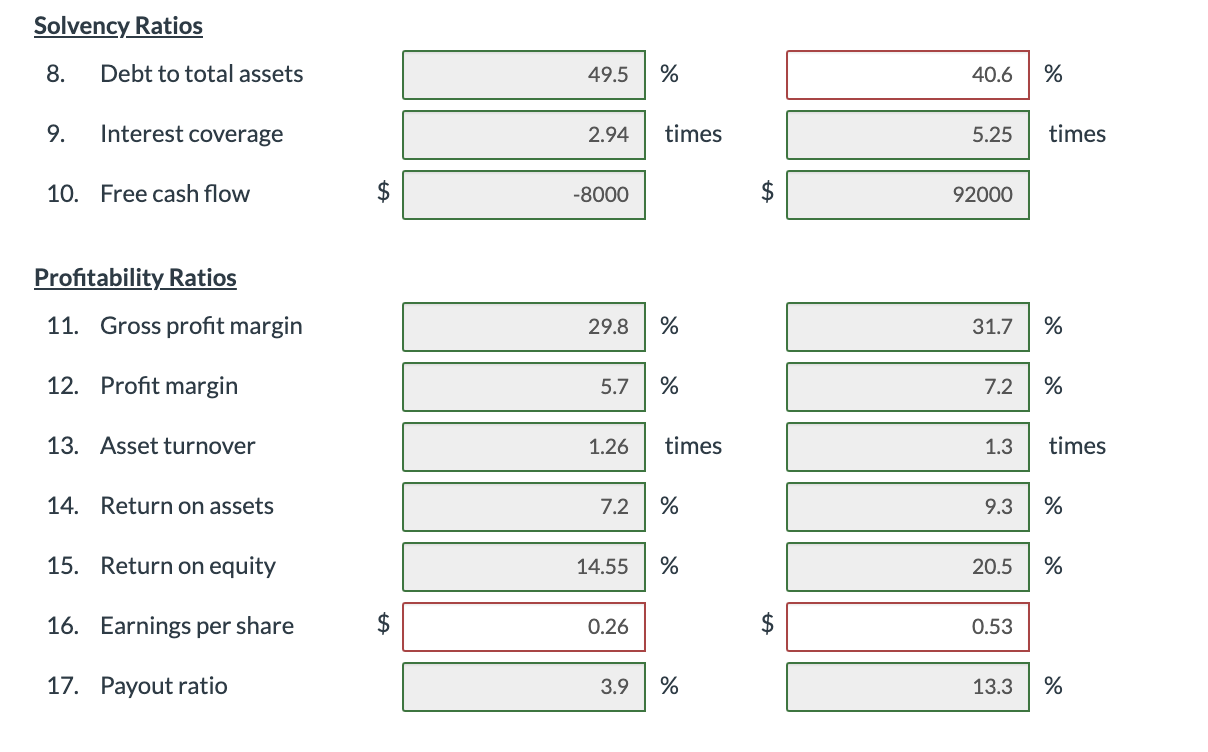
Comparative financial statements for Pharoah and Flounder Ltd. are shown below. PHAROAH AND FLOUNDER LTD. Income Statement Year Ended December 31, 2021 2020 Net sales $895,000 $835,000 Cost of goods sold 628.000 570.000 Gross profit 267,000 265,000 Operating expenses 164,000 160,000 Profit from operations 103,000 105,000 Other revenues and expenses Interest expense 35,000 20,000 Profit before income tax 68,000 85,000 Income tax expense 17,000 25,000 Profit $51,000 $60,000 2019 $10,000 112,000 94,000 114,000 300,000 $630,000 PHAROAH AND FLOUNDER LTD. Balance Sheet December 31 Assets 2021 2020 Cash $96,000 $86,000 Accounts receivable 115,000 115,000 Inventories 135,000 125,000 Prepaid expenses 25,000 25,000 Land, buildings, and equipment 390,000 305,000 Total assets $761,000 $656,000 Liabilities and Shareholders' Equity Liabilities Notes payable $110,000 $100,000 Accounts payable 45,000 44,000 Accrued liabilities 32,000 45,000 Bonds payable, due 2024 190,000 150,000 Total liabilities 377,000 339,000 Shareholders' equity Common shares (20,000 issued) 200,000 200,000 Retained earnings 184,000 117,000 Total shareholders' equity 384,000 317,000 Total liabilities and shareholders' equity $761,000 $656,000 $100,000 50,000 35,000 177,000 362,000 200,000 68,000 268,000 $630,000 Additional information: 1. Seventy-five percent of the sales were on account. 2. The allowance for doubtful accounts was $4,000 in 2021, $5,000 in 2020, and $3,000 in 2019. 3. In 2021 and 2020, dividends of $2,000 and $8,000, respectively, were paid to the common shareholders. 4. Cash provided by operating activities was $103,500 in 2021 and $124,000 in 2020. 5. Cash used by investing activities was $111,500 in 2021 and $32,000 in 2020. Your answer is partially correct. Calculate all possible liquidity, solvency, and profitability ratios for 2021 and 2020. (Round answers for Collection period, Days sales in inventory, Operating cycle and Free cash flow to 0 decimal places, e.g. 125. Round answer for Earnings per share to 2 decimal places, e.g. 12.50. Round all other answers to 1 decimal place, e.g. 12.5 or 12.5%. Enter negative amount using either a negative sign preceding the number e.g. -45 or parentheses e.g. (45).) 2021 2020 Liquidity Ratios 1. Current ratio 1.98 1.86 1.2 :1 :1 Acid-test ratio 1.26 R 2. 3. Receivables turnover 5.8 times 5.5 times 4. Collection period 62.5 days 66.3 days Inventory turnover 4.83 times 5.21 times 6. Days sales in inventory 75.6 days 70.1 days 7. Operating cycle 138.1 days 136.5 days Solvency Ratios 8. Debt to total assets 40.6 % % times 9. 49.5 2.94 -8000 Interest coverage 5.25 times 10. Free cash flow -8000 92000 Profitability Ratios 11. Gross profit margin 29.8 31.7 12. Profit margin 5.7 7.2 13. Asset turnover 1.26 times 1.3 times 14. Return on assets 1 7 .2 % 9.3 9.3 % 15. Return on equity 20.5 % 16. Earnings per share $ 0 14.55 | % .26 3.9 % 0.26 $0 0.53 17. Payout ratio 13.3 %
Step by Step Solution
There are 3 Steps involved in it

Get step-by-step solutions from verified subject matter experts