

Question: Course: Financial Reporting Case Analysis Streaming Inc. (SI) is a 25-year-old company in the content streaming business. It sells monthly subscriptions, which allow access to
Course: Financial Reporting
Case Analysis
Streaming Inc. (SI) is a 25-year-old company in the content streaming business. It sells monthly subscriptions, which allow access to its library of original content shows and movies as well as licensed content. The company recently went public on the National Stock Exchange. Members can watch the shows and movies as many times as they want and for as long as they want. Revenues have been steadily growing due to a recent and pervasive pandemic. Many governments have imposed social isolation requirements as a means to slow down the spread of the virus and so many people are making greater use of streaming services. There is growing interest in the industry in general by investors looking to invest.
Increasingly, new entrants into the marketplace are threatening to take customers away. Just after year-end, one of the large tech companies announced that it was launching a new division that will be in direct competition with SIs core business. This is a concern for SI since the big tech company has a significant amount of ready cash that it will use to develop content and market its new product.
According to the companys financial statements streaming content obligations include amounts related to the acquisition, licensing and production of streaming content including commitments under various contracts. Obligations for the acquisition and licensing of content are incurred when the company enters into an agreement to obtain future titles. Certain agreements include obligations to license rights for unknown future titles (where the quantity or fees are not yet determinable). These are not recognized yet as obligations but are worth about $11 billion. The company is increasingly gathering significant amounts of data that may help them estimate these. They have just hired a new CPA who has a computer science background to work on algorithms that will help gather and analyze data. The question is what data is relevant and how much should they gather?
SI is in the process of developing a new show, which is planned to have 20 episodes. Costs incurred in developing the show include the following:
- Idea generation
- Market testing of concepts before locking into an idea/theme
- Script writing and editing
- Filming
- Payroll for actors, film crew, editing crew
- Payroll for supervisors (on set and in head office)
Costs are mounting and reaching the point where SI is unsure as to whether they will be able to recover them from future revenues (the costs incurred to date are more than for any show previously developed). Nonetheless, the preliminary and advance marketing of the concept has received very positive reviews and the show is almost ready to be launched. The company is planning a share issue to raise some additional funding to cover the costs of this and other new shows.
Once a show is launched, SI starts to depreciate the amounts capitalized to date. Many shows have about a 5-year life but about 20% of the shows are considered classics in that they continue to be watched well past that point. When a show is just launched, it is difficult to know if it will become a classic or not. As a rule, new shows are watched more in the early years than later on although classic shows tend to be watched more evenly over time. SI is finding that more and more of its shows are seen as classics especially in the last three years. This may be due to a new targeted marketing campaign using AI that was initiated in 2018. Depreciation expense in included in cost of revenues and was $9.2 billion in 2019.
Some of the classic shows from the early years of the company have started to get some negative publicity due to content that is no longer culturally or socially acceptable by some groups. The company at this point has decided to keep these shows in the library but is watching things closely to see if the negative publicity may hurt their future growth. The shows are still accessed and watched by a substantial portion of the subscriber base but SI has started to see a decline in the number of times accessed.
The company sells memberships in Canada as well as the United States. U.S. customers pay in $U.S. and this segment has been growing rapidly in the past 5 years. Given that the $U.S. currency has been strengthening in the past couple of years, SI had decided not to hedge the $U.S. revenue stream. Currently however, it looks like the Canadian dollar has begun to strengthen against the $U.S. primarily due to political instability in the U.S. The company is planning to enter into a hedge using derivatives and is not sure whether to use hedge accounting.
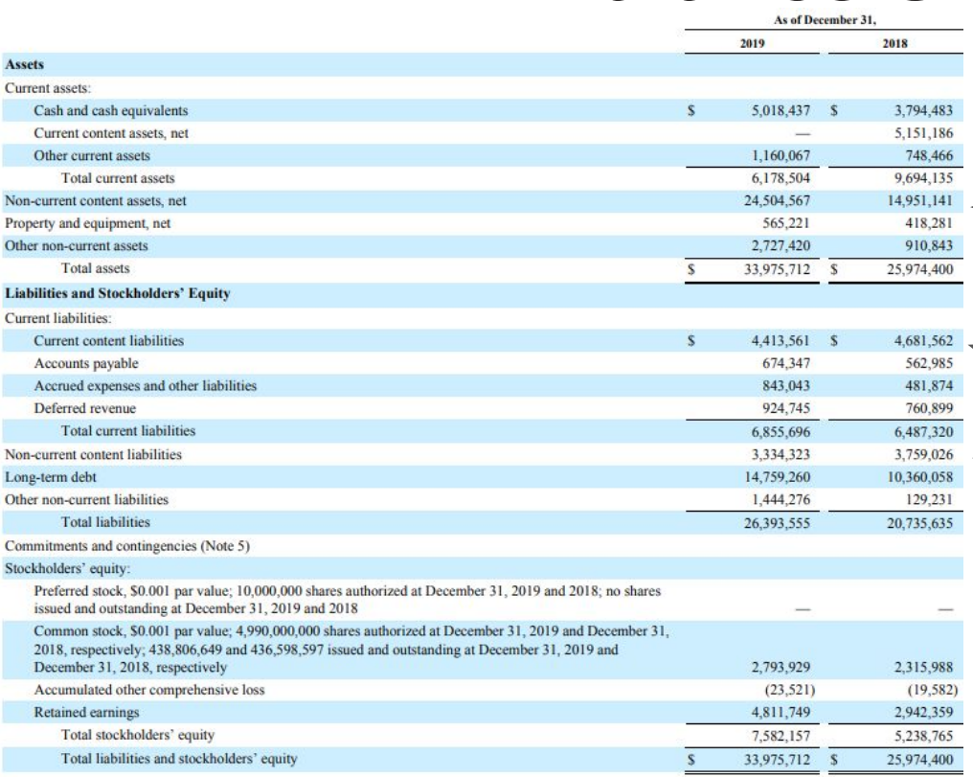
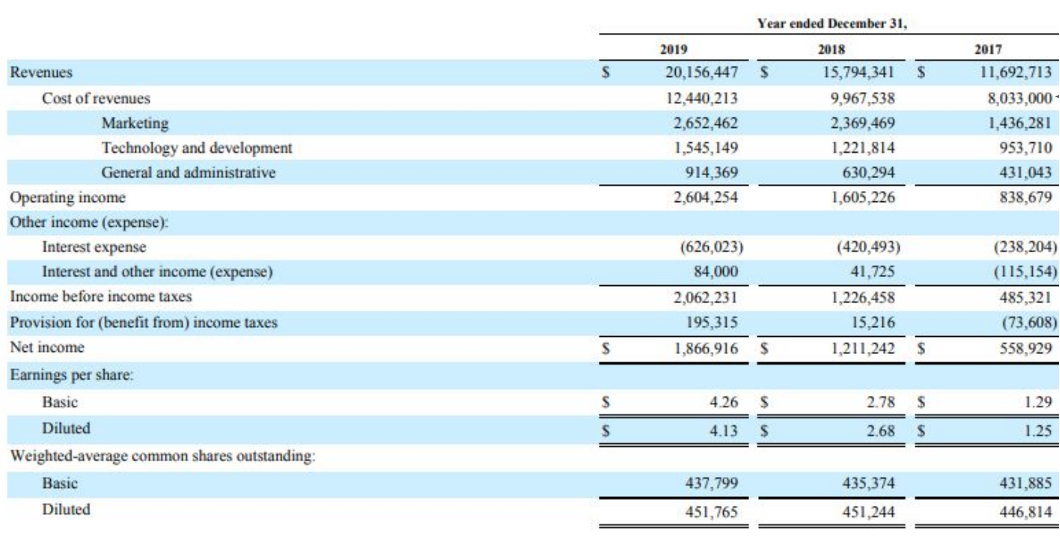
Excerpts from the financial statements follow. Numbers are all in thousands of dollars (000s).
Required:
Assume the role of the company's auditors and analyze the financial reporting issues. Use the case analysis approach as shown below.
Financial Statements:
Case Analysis Approach (just a demonstration):
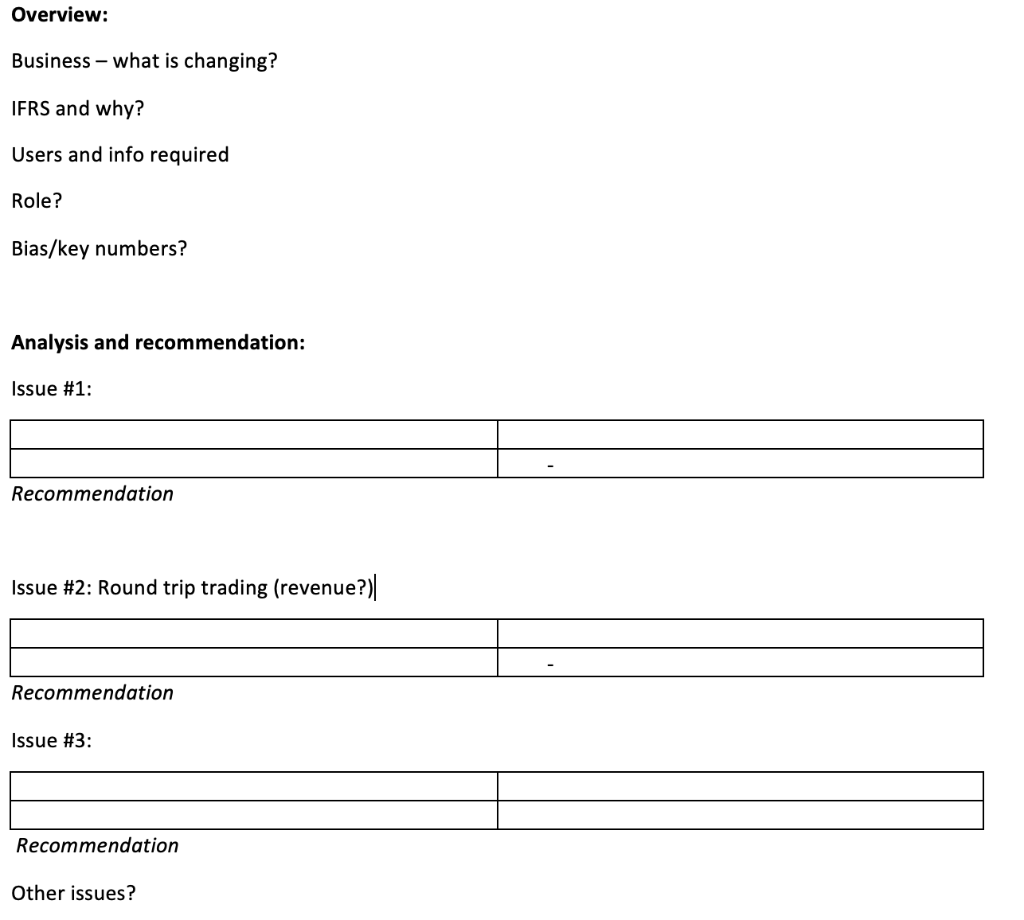
As of December 31, 2019 2018 s 5,018,437 s 1,160,067 6,178,504 24,504,567 565,221 2,727,420 33,975,712 $ 3,794,483 5,151,186 748,466 9,694,135 14,951,141 418,281 910,843 25,974,400 S s S Assets Current assets Cash and cash equivalents Current content assets, net Other current assets Total current assets Non-current content assets, net Property and equipment, net Other non-current assets Total assets Liabilities and Stockholders' Equity Current liabilities: Current content liabilities Accounts payable Accrued expenses and other liabilities Deferred revenue Total current liabilities Non-current content liabilities Long-term debt Other non-current liabilities Total liabilities Commitments and contingencies (Note 5) Stockholders' equity: Preferred stock, $0.001 par value; 10,000,000 shares authorized at December 31, 2019 and 2018, no shares issued and outstanding at December 31, 2019 and 2018 Common stock, $0.001 par value; 4,990,000,000 shares authorized at December 31, 2019 and December 31, 2018, respectively, 438,806,649 and 436,598,597 issued and outstanding at December 31, 2019 and December 31, 2018, respectively Accumulated other comprehensive loss Retained earnings Total stockholders' equity Total liabilities and stockholders' equity 4,413,561 674,347 843,043 924,745 6,855,696 3,334,323 14.759.260 1,444,276 26,393,555 4,681,562 562,985 481,874 760,899 6,487,320 3,759,026 10,360,058 129,231 20,735,635 2,793,929 (23,521) 4,811,749 7,582,157 33,975,712 2,315,988 (19,582) 2,942,359 5,238,765 25,974,400 S S Year ended December 31, 2018 S $ s 2019 20,156,447 12,440,213 2,652,462 1,545,149 914,369 2,604,254 15,794,341 9,967,538 2,369,469 1,221,814 630,294 1,605,226 2017 11,692,713 8,033,000 1,436,281 953,710 431,043 838,679 Revenues Cost of revenues Marketing Technology and development General and administrative Operating income Other income (expense): Interest expense Interest and other income (expense) Income before income taxes Provision for benefit from income taxes Net income Earnings per share Basic Diluted Weighted average common shares outstanding: Basic Diluted (626,023) 84,000 2,062,231 195,315 1,866,916 (420,493) 41,725 1,226,458 15,216 1,211,242 (238,204) (115,154) 485,321 (73,608) 558,929 S S 4.26 $ 2.78 $ 1.29 S 4.13 $ 2.68 S 1.25 437,799 435,374 431,885 451,765 451,244 446,814 Overview: Business - what is changing? IFRS and why? Users and info required Role? Bias/key numbers? Analysis and recommendation: Issue #1: Recommendation Issue #2: Round trip trading (revenue?)| Recommendation Issue #3: Recommendation Other issues? As of December 31, 2019 2018 s 5,018,437 s 1,160,067 6,178,504 24,504,567 565,221 2,727,420 33,975,712 $ 3,794,483 5,151,186 748,466 9,694,135 14,951,141 418,281 910,843 25,974,400 S s S Assets Current assets Cash and cash equivalents Current content assets, net Other current assets Total current assets Non-current content assets, net Property and equipment, net Other non-current assets Total assets Liabilities and Stockholders' Equity Current liabilities: Current content liabilities Accounts payable Accrued expenses and other liabilities Deferred revenue Total current liabilities Non-current content liabilities Long-term debt Other non-current liabilities Total liabilities Commitments and contingencies (Note 5) Stockholders' equity: Preferred stock, $0.001 par value; 10,000,000 shares authorized at December 31, 2019 and 2018, no shares issued and outstanding at December 31, 2019 and 2018 Common stock, $0.001 par value; 4,990,000,000 shares authorized at December 31, 2019 and December 31, 2018, respectively, 438,806,649 and 436,598,597 issued and outstanding at December 31, 2019 and December 31, 2018, respectively Accumulated other comprehensive loss Retained earnings Total stockholders' equity Total liabilities and stockholders' equity 4,413,561 674,347 843,043 924,745 6,855,696 3,334,323 14.759.260 1,444,276 26,393,555 4,681,562 562,985 481,874 760,899 6,487,320 3,759,026 10,360,058 129,231 20,735,635 2,793,929 (23,521) 4,811,749 7,582,157 33,975,712 2,315,988 (19,582) 2,942,359 5,238,765 25,974,400 S S Year ended December 31, 2018 S $ s 2019 20,156,447 12,440,213 2,652,462 1,545,149 914,369 2,604,254 15,794,341 9,967,538 2,369,469 1,221,814 630,294 1,605,226 2017 11,692,713 8,033,000 1,436,281 953,710 431,043 838,679 Revenues Cost of revenues Marketing Technology and development General and administrative Operating income Other income (expense): Interest expense Interest and other income (expense) Income before income taxes Provision for benefit from income taxes Net income Earnings per share Basic Diluted Weighted average common shares outstanding: Basic Diluted (626,023) 84,000 2,062,231 195,315 1,866,916 (420,493) 41,725 1,226,458 15,216 1,211,242 (238,204) (115,154) 485,321 (73,608) 558,929 S S 4.26 $ 2.78 $ 1.29 S 4.13 $ 2.68 S 1.25 437,799 435,374 431,885 451,765 451,244 446,814 Overview: Business - what is changing? IFRS and why? Users and info required Role? Bias/key numbers? Analysis and recommendation: Issue #1: Recommendation Issue #2: Round trip trading (revenue?)| Recommendation Issue #3: Recommendation Other issues
Step by Step Solution
There are 3 Steps involved in it

Get step-by-step solutions from verified subject matter experts