

Question: Course Home x Do Homework - Go - Graded W x + C A mylab.pearson.com/Student/PlayerHomework.aspx?homeworkid=624845444&questionid=17&flushed=true&cld=6947481¢erwin=yes @ @ * STAT 200 6379 Zaire Lewis 07/09/22 8:33
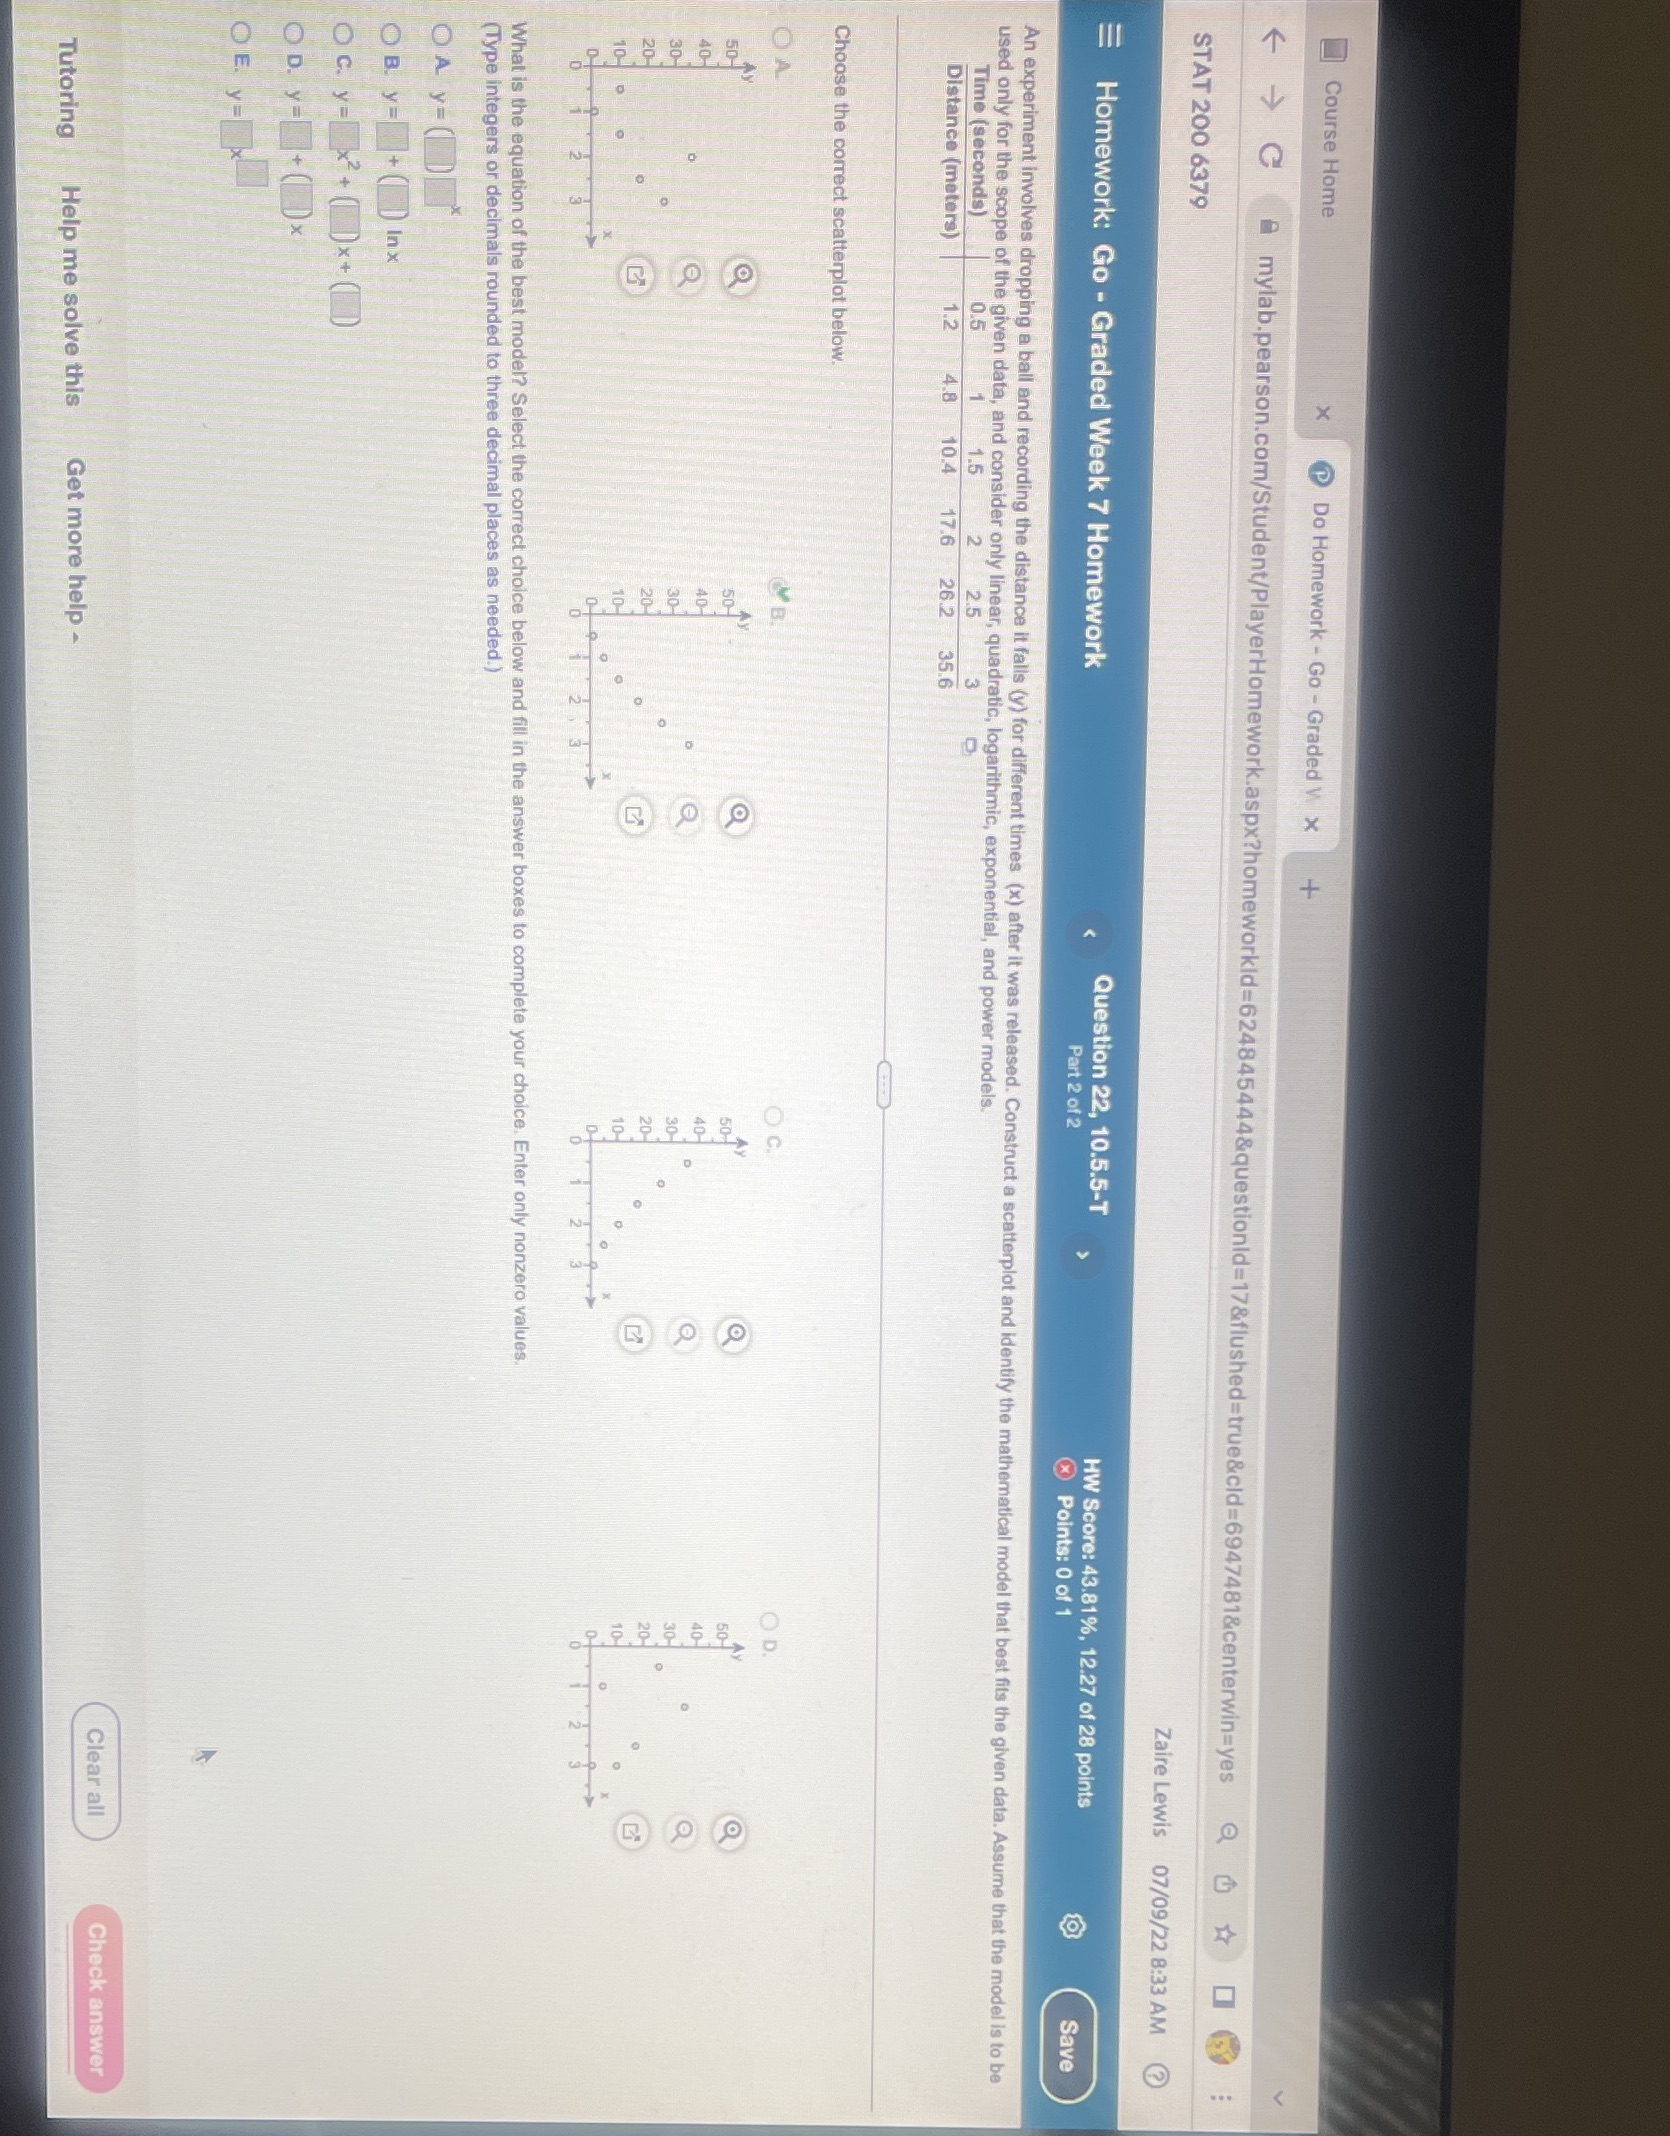

Course Home x Do Homework - Go - Graded W x + C A mylab.pearson.com/Student/PlayerHomework.aspx?homeworkid=624845444&questionid=17&flushed=true&cld=6947481¢erwin=yes @ @ * STAT 200 6379 Zaire Lewis 07/09/22 8:33 AM Homework: Go - Graded Week 7 Homework Question 22, 10.5.5-T Part 2 of 2 HW Score: 43.81%, 12.27 of 28 points Points: 0 of 1 Save An experiment involves dropping a ball and recording the distance it falls (y) for different times (x) after it was released. Construct a scatterplot and identify the mathematical model that best fits the given data. Assume that the model is to be used only for the scope of the given data, and consider only linear, quadratic, logarithmic, exponential, and power models. Time (seconds) 0.5 1 1.5 2 2.5 3 Distance (meters) 1.2 4.8 10.4 1 26.2 35.6 Choose the correct scatterplot below. OA OD AY 50- 40- 30- 20- 10- What is the equation of the best model? Select the correct choice below and fill in the answer boxes to complete your choice. Enter only nonzero values. (Type integers or decimals rounded to three decimal places as needed.) DAY= D OB. y = + ( ) Inx O c. y = \\ + ( D X + ( D OD. y = + () X OE y = Clear all Check answer Tutoring Help me solve this Get more help
Step by Step Solution
There are 3 Steps involved in it

Get step-by-step solutions from verified subject matter experts