

Question: Course Login - North Carolina x = Module Nine Post-Assessment X Quiz: Module Nine Post-Asses: X Bb AP Stat Unit 11 Review solution x |
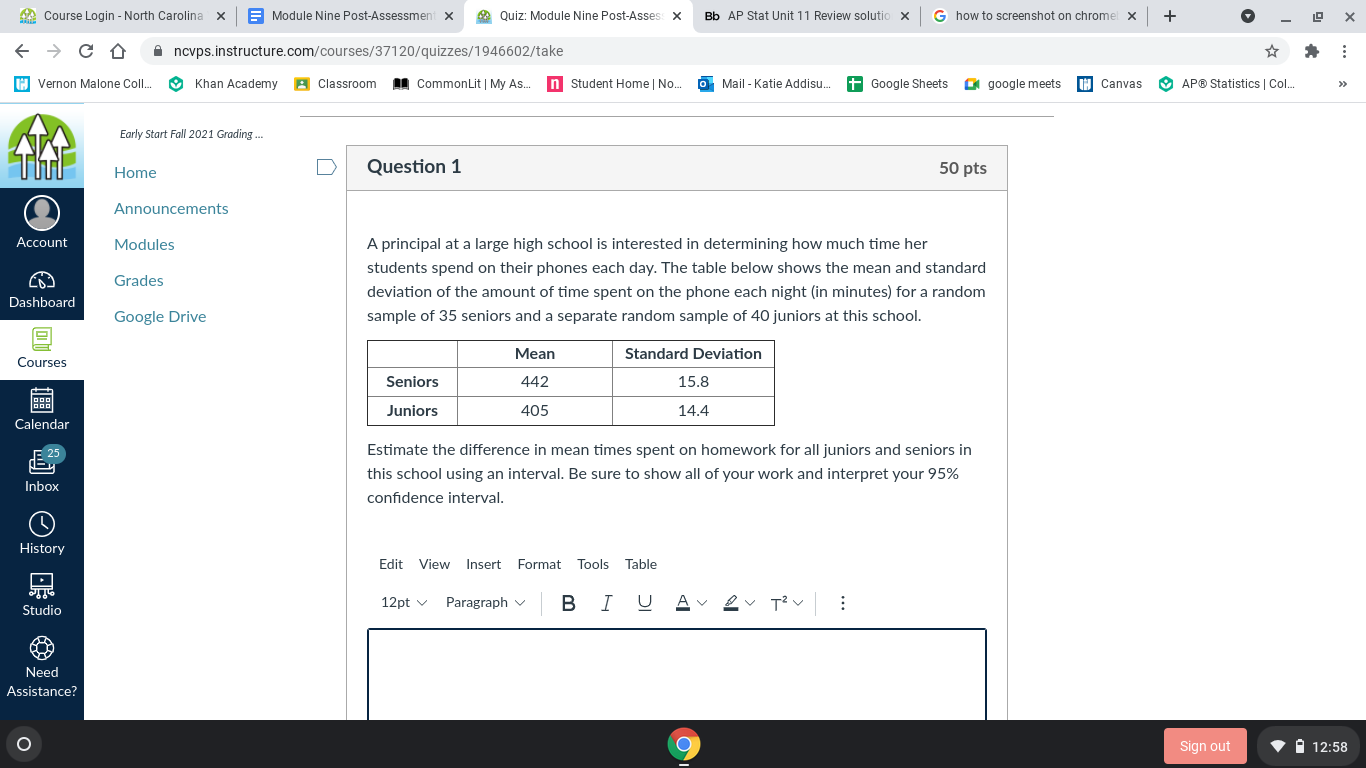

Course Login - North Carolina x = Module Nine Post-Assessment X Quiz: Module Nine Post-Asses: X Bb AP Stat Unit 11 Review solution x | G how to screenshot on chromel x + X C D ncvps.instructure.com/courses/37120/quizzes/1946602/take IN Vernon Malone Coll.. Khan Academy _ Classroom CommonLit | My As. n Student Home | No.. . Mail - Katie Addisu. + Google Sheets google meets IN Canvas AP@ Statistics | Col. Early Start Fall 2021 Grading .. Home D Question 1 50 pts Announcements Account Modules A principal at a large high school is interested in determining how much time her students spend on their phones each day. The table below shows the mean and standard Grades Dashboard deviation of the amount of time spent on the phone each night (in minutes) for a random Google Drive sample of 35 seniors and a separate random sample of 40 juniors at this school. 9 Mean Standard Deviation Courses Seniors 442 15.8 Juniors 405 14.4 Calendar Estimate the difference in mean times spent on homework for all juniors and seniors in this school using an interval. Be sure to show all of your work and interpret your 95% Inbox confidence interval. History Edit View Insert Format Tools Table Studio 12pt w Paragraph B I U Av QV Try ! Need Assistance? Sign out 12:58
Step by Step Solution
There are 3 Steps involved in it

Get step-by-step solutions from verified subject matter experts