

Question: Course Name: Investment Analysis Course Code: FIN 420 I need all answers with formula and not with excel please :) There are given Portfolios of
Course Name: Investment Analysis
Course Code: FIN 420
I need all answers with formula and not with excel please :)
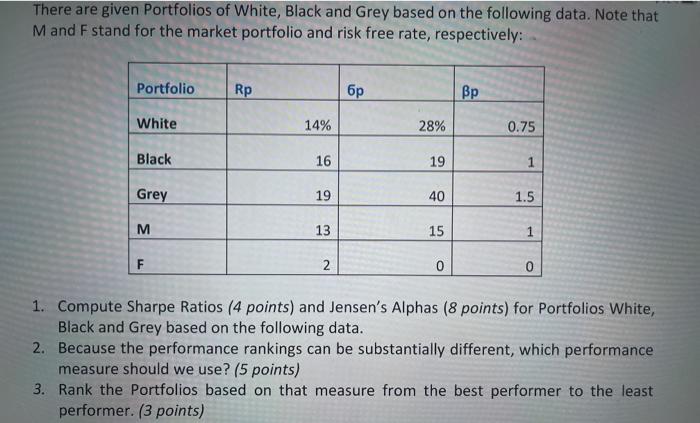
There are given Portfolios of White, Black and Grey based on the following data. Note that Mand F stand for the market portfolio and risk free rate, respectively: Portfolio Rp Bp White 14% 28% 0.75 Black 16 19 1 Grey 19 40 1.5 M 13 15 1 F 2 0 0 1. Compute Sharpe Ratios (4 points) and Jensen's Alphas (8 points) for Portfolios White, Black and Grey based on the following data. 2. Because the performance rankings can be substantially different, which performance measure should we use? (5 points) 3. Rank the Portfolios based on that measure from the best performer to the least performer. (3 points)
Step by Step Solution
There are 3 Steps involved in it
1 Expert Approved Answer
Step: 1 Unlock

Question Has Been Solved by an Expert!
Get step-by-step solutions from verified subject matter experts
Step: 2 Unlock
Step: 3 Unlock