

Question: Coursepack, p. 601 MAT 133: (FA22) Sample Midterm Exam, p.3 4) The TIMSS study gives science tests to high school students in different countries. The
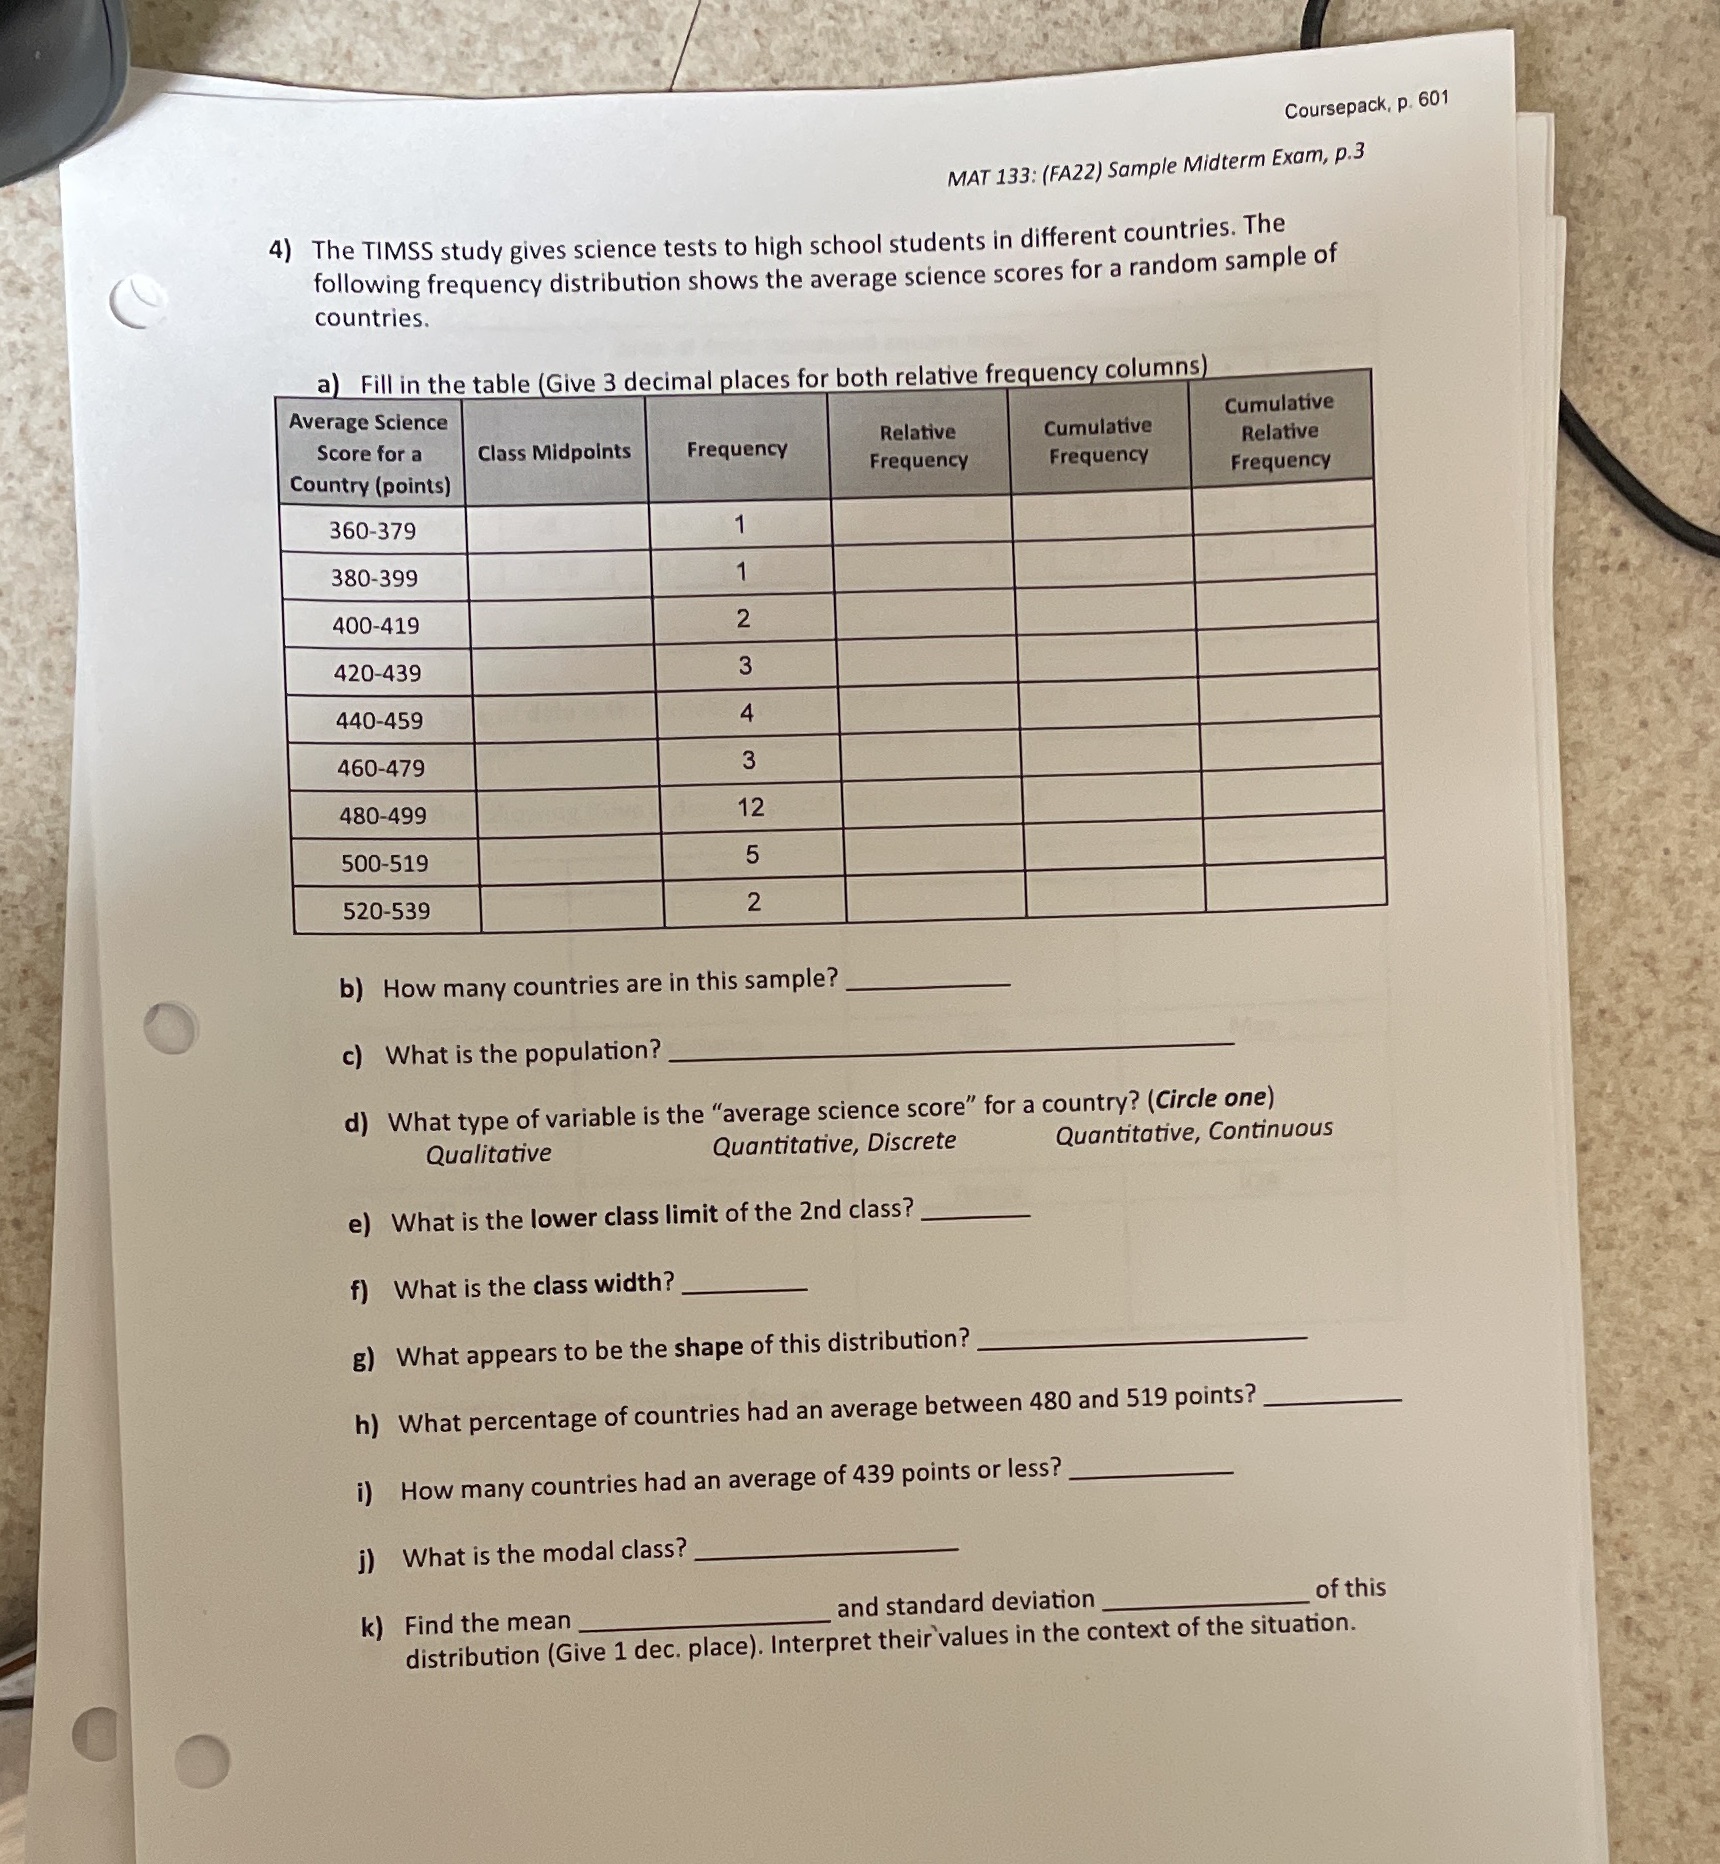

Coursepack, p. 601 MAT 133: (FA22) Sample Midterm Exam, p.3 4) The TIMSS study gives science tests to high school students in different countries. The C following frequency distribution shows the average science scores for a random sample of countries. a) Fill in the table (Give 3 decimal places for both relative frequency columns) Average Science Cumulative Score for a Class Midpoints Frequency Relative Cumulative Relative Country (points) Frequency Frequency Frequency 360-379 1 380-399 1 400-419 2 420-439 3 440-459 4 460-479 3 480-499 12 500-519 5 520-539 N b) How many countries are in this sample? c) What is the population? d) What type of variable is the "average science score" for a country? (Circle one) Qualitative Quantitative, Discrete Quantitative, Continuous e) What is the lower class limit of the 2nd class? f) What is the class width? g) What appears to be the shape of this distribution? h) What percentage of countries had an average between 480 and 519 points? i) How many countries had an average of 439 points or less? j) What is the modal class? k) Find the mean_ and standard deviation _ of this distribution (Give 1 dec. place). Interpret their values in the context of the situation
Step by Step Solution
There are 3 Steps involved in it

Get step-by-step solutions from verified subject matter experts