

Question: CoursHeroTranscribedText Table 1 CT SYMPHONY CASE EXHIBITS CT Symphony Proposed Season Concert Type Average Ticket Price Number of Nights Tickets Sold Variable Cost/Night Beethoven &
CoursHeroTranscribedText
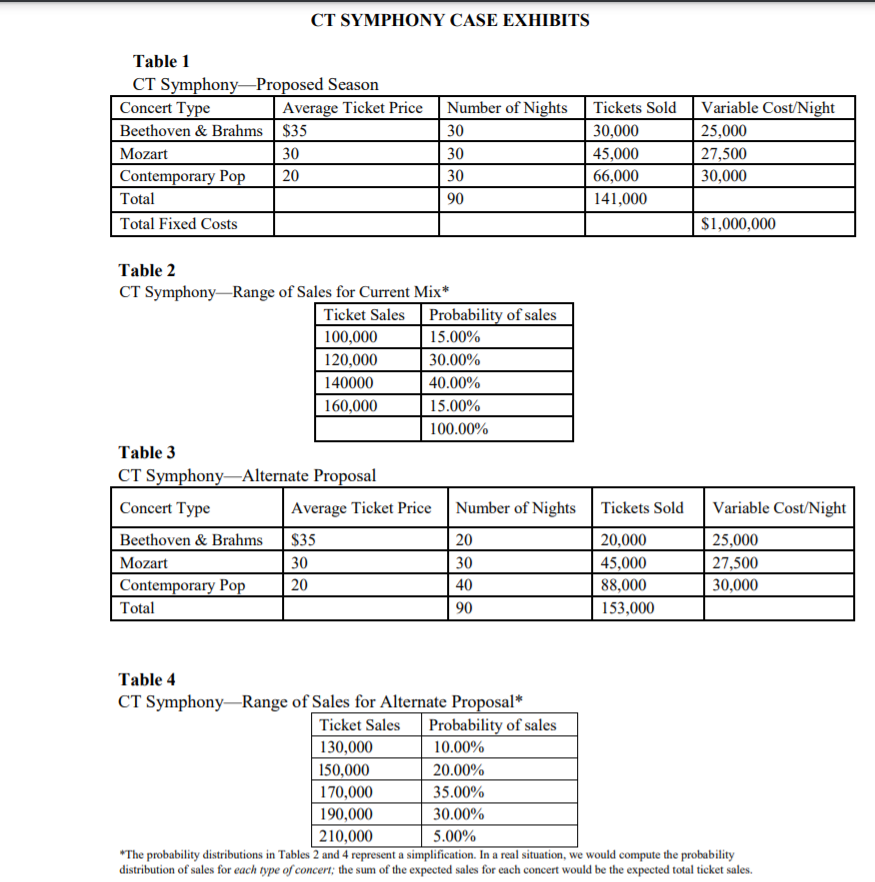
Table 1 CT SYMPHONY CASE EXHIBITS CT Symphony Proposed Season Concert Type Average Ticket Price Number of Nights Tickets Sold Variable Cost/Night Beethoven & Brahms |$35 30 30,000 25,000 Mozart 30 30 45,000 27,500 Contemporary Pop 20 30 66,000 30,000 Total 90 141,000 Total Fixed Costs $1,000,000 Table 2 CT Symphony-Range of Sales for Current Mix* Ticket Sales Probability of sales 100,000 15.00% 120,000 30.00% 140000 40.00% 160,000 15.00% 100.00% Table 3 CT Symphony-Alternate Proposal Concert Type Average Ticket Price Number of Nights Tickets Sold Variable Cost/Night Beethoven & Brahms $35 20 20,000 25,000 Mozart 30 30 45,000 27,500 Contemporary Pop 20 40 88,000 30,000 Total 90 153,000 Table 4 CT Symphony Range of Sales for Alternate Proposal* Ticket Sales Probability of sales 130,000 10.00% 150,000 20.00% 170,000 35.00% 190,000 30.00% 210,000 5.00% *The probability distributions in Tables 2 and 4 represent a simplification. In a real situation, we would compute the probability distribution of sales for each type of concert; the sum of the expected sales for each concert would be the expected total ticket sales.
Step by Step Solution
There are 3 Steps involved in it

Get step-by-step solutions from verified subject matter experts