

Question: Covid19 Vaccination Rates This question comes from a recent study (April 7, 2022), which uses multiple regression estimated with ordinary least squares (OLS) to explain
Covid19 Vaccination Rates This question comes from a recent study (April 7, 2022), which uses multiple regression estimated with ordinary least squares (OLS) to explain differences in Covid19 vaccination rates and booster rates by ZIP code in Massachusetts (n= 418). The reference is Bor, Jacob, et al. (2022)."Inequities in COVID19 Vaccine and Booster Coverage across Massachusetts ZIP Codes:Large Gaps Persist after the 2021/22 Omicron Wave." Note a few things about the table below (from p. 27).First, median household income is measured in thousands of dollars so 60, for example, is $60,000. Second, the standard errors in parenthesis are modified from the usual OLS standard errors, but they can be interpreted in the same manner.Finally, a VEI community (p. 3) is described as: "In February 2021, the BakerPolito Administration launched the MA Vaccine Equity Initiative (VEI) to address vaccine hesitancy and improve vaccine administration rates in the twenty most disproportionately impacted communities.These communities were identified based on COVID19 case rates, CDCdefined social vulnerability, and the share Black, Indigenous, and people of color.These populations, as well as the overlapping population of essential workers, have been at elevated risk for COVID exposure, infection, morbidity, and mortality throughout the pandemic. The VEI allocated has awarded $46.5 million to 167 community organizations to support vaccine education and outreach." The results from the study are
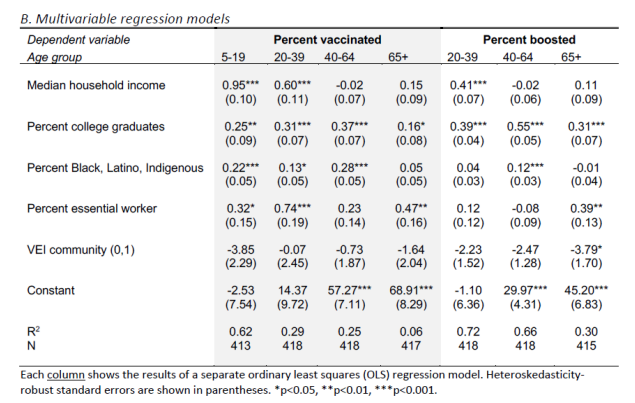
B. Multivariable regression models Dependent variable Percent vaccinated Percent boosted Age group 5-19 20-39 40-64 65+ 20-39 40-64 65+ Median household income 0.95* 0.60* -0.02 0.15 0.41* -0.02 0.11 (0.10) (0.11) (0.07) (0.09) (0.07) (0.06) (0.09) Percent college graduates 0.25** 0.31** 0.16 0.39*#* 0.55*#* 0.31*#* (0.09) (0.07) (0.07) (0.08) (0.04) (0.05) (0.07) Percent Black, Latino, Indigenous 0.22**# 0.13* 0.28*## 0.05 0.04 0.12*# -0.01 (0.05) (0.05) (0.05) (0.05) (0.03) (0.03) (0.04) Percent essential worker 0.32* 0.74" 0.23 0,47** 0.12 -0.08 0,39** (0.15) (0.19) (0.14) (0.16) (0.12) (0.09) (0.13) VEI community (0,1) -3.85 -0.07 -0.73 -1.64 -2.23 -2.47 -3.79* (2.29) (2.45) (1.87) (2.04) (1.52) (1.28) (1.70) Constant -2.53 14.37 57.27** * 68.91*** -1.10 29.97*** 45.20** (7.54) (9.72) (7.11) (8.29) (6.36) (4.31) (6.83) RZ 0.62 0.29 0.25 0.06 0.72 0.66 0.30 N 413 418 418 417 418 418 415 Each column shows the results of a separate ordinary least squares (OLS) regression model. Heteroskedasticity- robust standard errors are shown in parentheses. *p
Step by Step Solution
There are 3 Steps involved in it

Get step-by-step solutions from verified subject matter experts