

Question: cre CREATE Create a new worksheet in the database to compute gross revenues by month and region, as well as world-wide totals, for each product
cre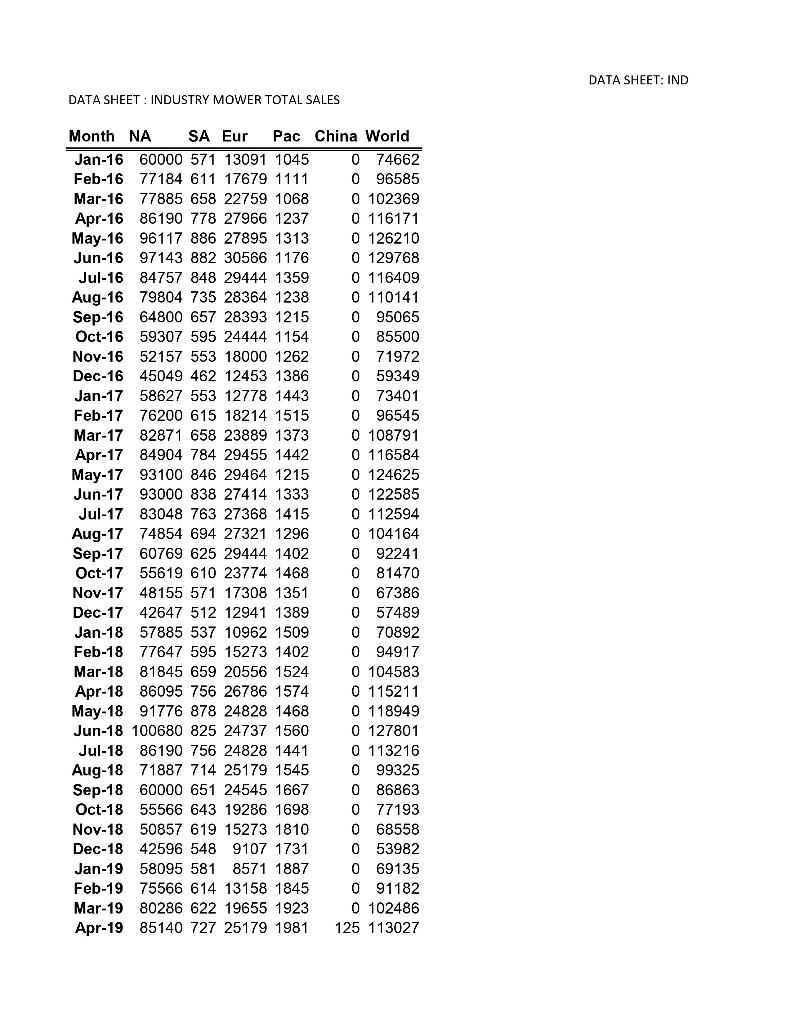
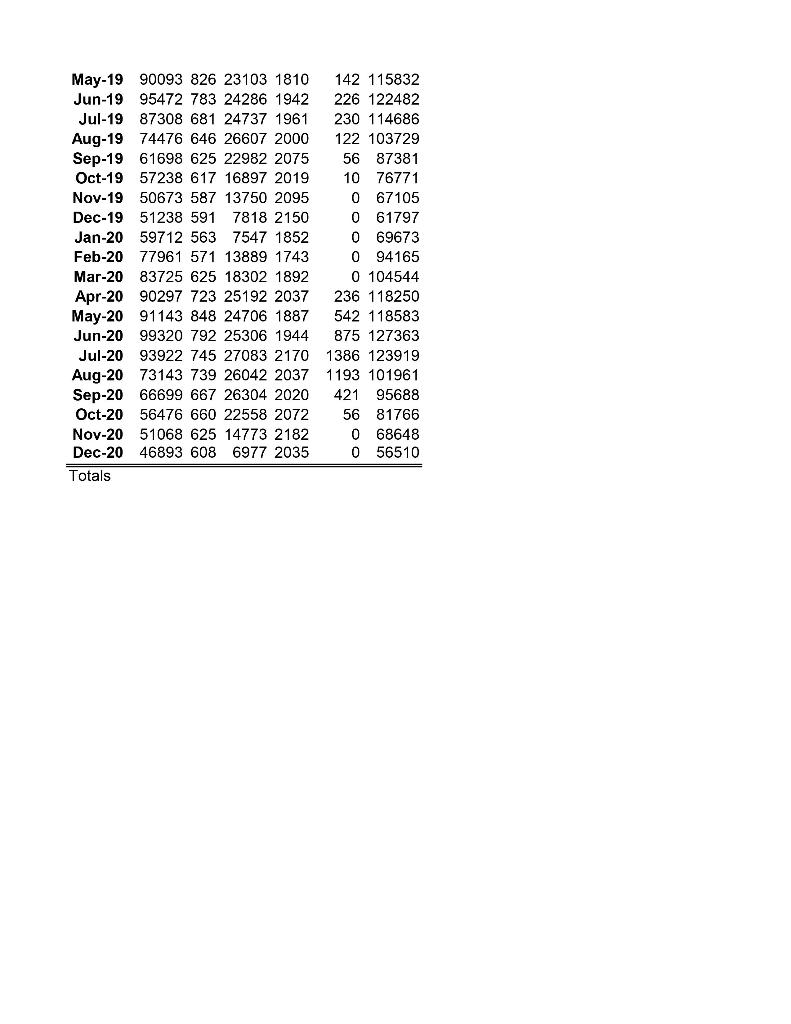
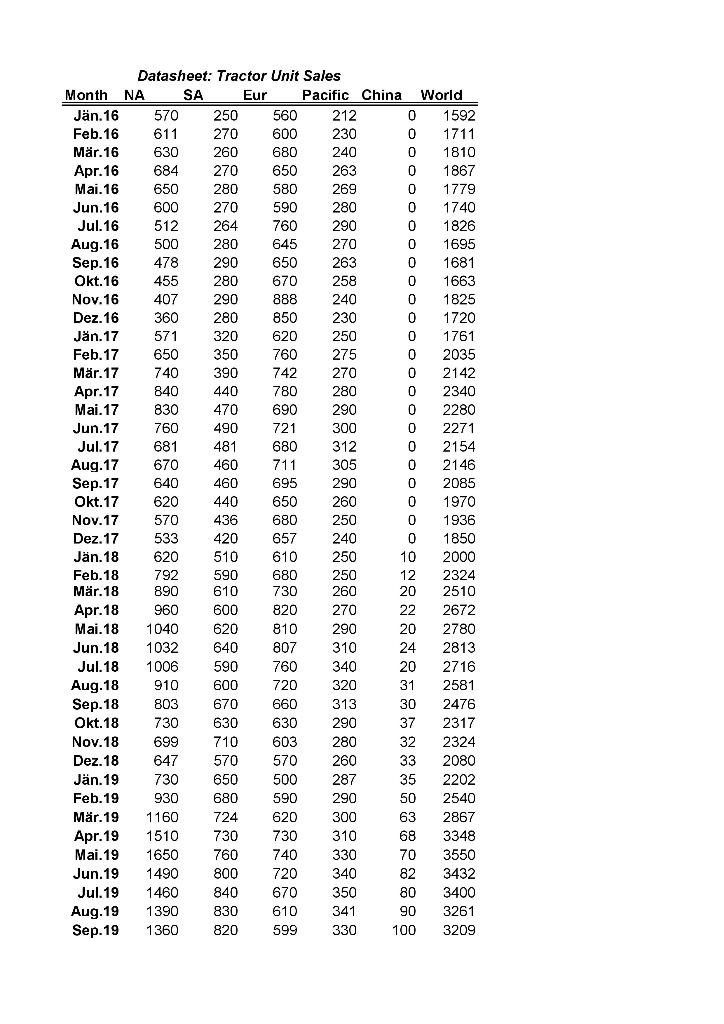
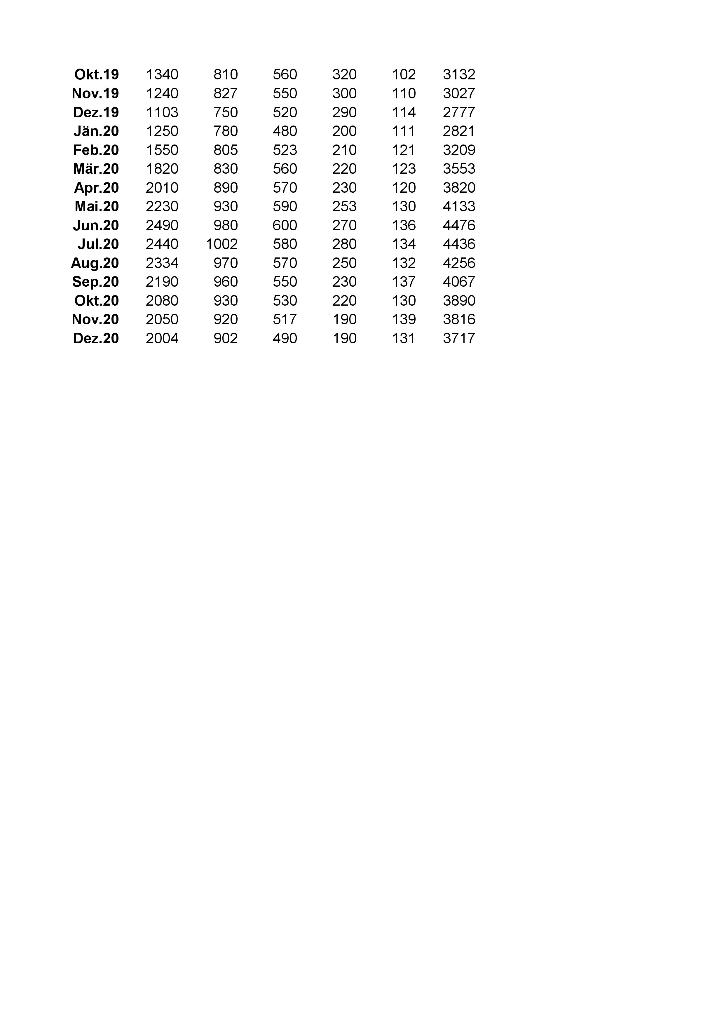
CREATE Create a new worksheet in the database to compute gross revenues by month and region, as well as world-wide totals, for each product using the data in Industry Mower Total Sales and Tractor Unit Sales?
| years | mower price | tractor price |
| 2016 | 105 | 3200 |
| 2017 | 155 | 3450 |
| 2018 | 180 | 3400 |
| 2019 | 180 | 3750 |
| 2020 | 180 | 3300 |
John Deer (JD), headquartered in Moline, IL, is a designer and producer of tractors and lawnmowers used by homeowners. In the past 10 years, John Deer has added a new series of E10 lawn tractors. This tractor builds for exceptional traction on rolling hills and wet fields. John Deer provides most of the products to dealerships, which, in turn, sell directly to end-users. John Deer employs 1,660 people worldwide. About half the workforce is based in Moline; the remainder is split among their manufacturing plants. In the United States, the focus of sales is on the eastern seaboard, California, the Southeast, and the south-central states, which have the greatest concentration of customers. Outside the United States, JDs sales include a European market, a growing South American market, and developing markets in the Pacific Rim and China. The market is cyclical, but the different products and regions balance some of this, with just less than 30% of total sales in the spring and summer (in the United States), about 25% in the fall, and about 20% in the winter. Annual sales are approximately $180 million.
Both end-users and dealers have been established as important customers for JD. Collection and analysis of end-user data showed that satisfaction with the products depends on high quality, easy attachment/dismount of improvements, low maintenance,price value, and service. For dealers, key requirements are high quality, parts and feature availability, rapid restock, discounts, and timeliness of support. John Deer has several key suppliers: Mitsitsiu, Inc., the sole source of all diesel engines; LANTO Axles, Inc. which provides tractor axles; Schorst Fabrication, which provides subassemblies; Cuberillo, Inc, supplier of transmissions; and Specialty Machining, Inc., a supplier of precision machine parts. John Deer managers have developed a balanced scorecard of measures. These data, which are summarized shortly, are stored in the form of a Microsoft Excel workbook (John Deer). The database contains various measures captured on a monthly or quarterly basis and used by various managers to evaluate business performance. Data for each of the key measures are stored in a separate worksheet. A summary of these worksheets is given next: Worksheets
DATA SHEET: IND DATA SHEET : INDUSTRY MOWER TOTAL SALES Month NA SA Eur Pac China World Jan-16 60000 571 13091 1045 0 74662 Feb-16 77184 611 17679 1111 0 96585 Mar-16 77885 658 22759 1068 0102369 Apr-16 86190 778 27966 1237 0 116171 May-16 96117 886 27895 1313 0 126210 Jun-16 97143 882 30566 1176 0 129768 Jul-16 84757 848 29444 1359 0 116409 Aug-16 79804 735 28364 1238 0 110141 Sep-16 64800 657 28393 1215 0 95065 Oct-16 59307 595 24444 1154 0 85500 Nov-16 52157 553 18000 1262 071972 Dec-16 45049 462 12453 1386 059349 Jan-17 58627 553 12778 1443 0 73401 Feb-17 76200 615 18214 1515 096545 Mar-17 82871 658 23889 1373 0 108791 Apr-17 84904 784 29455 1442 0 116584 May-17 93100 846 29464 1215 0 124625 Jun-17 93000 838 27414 1333 0 122585 Jul-17 83048 763 27368 1415 0 112594 Aug-17 74854 694 27321 1296 0 104164 Sep-17 60769 625 29444 1402 092241 Oct-17 55619 610 23774 1468 0 81470 Nov-17 48155 571 17308 1351 0 67386 Dec-17 42647 512 12941 1389 0 57489 Jan-18 57885 537 10962 1509 0 70892 Feb-18 77647 595 15273 1402 094917 Mar-18 81845 659 20556 1524 0 104583 Apr-18 86095 756 26786 1574 0 115211 May-18 91776 878 24828 1468 0 118949 Jun-18 100680 825 24737 1560 0 127801 Jul-18 86190 756 24828 1441 0 113216 Aug-18 71887 714 25179 1545 0 99325 Sep-18 60000 651 24545 1667 0 86863 Oct-18 55566 643 19286 1698 0 77193 Nov-18 50857 619 15273 1810 0 68558 Dec-18 42596 548 9107 1731 0 53982 Jan-19 58095 581 8571 1887 0 69135 Feb-19 75566 614 13158 1845 091182 Mar-19 80286 622 19655 1923 0 102486 Apr-19 85140 727 25179 1981 125 113027 May-19 90093 826 23103 1810 142 115832 Jun-19 95472 783 24286 1942 226 122482 Jul-19 87308 681 24737 1961 230 114686 Aug-19 74476 646 26607 2000 122 103729 Sep-19 61698 625 22982 2075 56 87381 Oct-19 57238 617 16897 2019 10 76771 Nov-19 50673 587 13750 2095 067105 Dec-19 51238 591 7818 2150 0 61797 Jan-20 59712 563 7547 1852 069673 Feb-20 77961 571 13889 1743 0 94165 Mar-20 83725 625 18302 1892 0 104544 Apr-20 90297 723 25192 2037 236 118250 May-20 91143 848 24706 1887 542 118583 Jun-20 99320 792 25306 1944 875 127363 Jul-20 93922 745 27083 2170 1386 123919 Aug-20 73143 739 26042 2037 1193 101961 Sep-20 66699 667 26304 2020 421 95688 Oct-20 56476 660 22558 2072 56 81766 Nov-20 51068 625 14773 2182 C 68648 Dec-20 46893 608 6977 2035 0 56510 Totals 1810 Datasheet: Tractor Unit Sales Month NA SA Eur Pacific China World Jn. 16 570 250 560 212 0 1592 Feb.16 611 270 600 230 0 1711 Mr. 16 630 260 680 240 0 Apr. 16 684 270 650 263 0 1867 Mai.16 650 280 580 269 0 1779 Jun. 16 600 270 590 280 0 1740 Jul. 16 512 264 760 290 0 1826 Aug. 16 500 280 645 270 0 1695 Sep. 16 478 290 650 263 0 1681 Okt. 16 455 280 670 258 0 1663 Nov.16 407 290 888 240 0 1825 Dez. 16 360 280 850 230 0 1720 Jn. 17 571 320 620 250 0 1761 Feb. 17 650 350 760 275 0 2035 Mr. 17 740 390 742 270 0 2142 Apr. 17 840 440 780 280 0 2340 Mai. 17 830 470 690 290 0 2280 Jun. 17 760 490 721 300 0 2271 Jul. 17 681 481 680 312 0 2154 Aug. 17 670 460 711 305 0 2146 Sep. 17 640 460 695 290 0 2085 Okt. 17 620 440 650 260 0 1970 Nov. 17 570 436 680 250 0 1936 Dez. 17 533 420 657 240 0 1850 Jan. 18 620 510 610 250 10 2000 Feb.18 792 590 680 250 12 2324 Mr. 18 890 610 730 260 20 2510 Apr. 18 960 600 820 270 22 2672 Mai. 18 1040 620 810 290 20 2780 Jun. 18 1032 640 807 310 24 2813 Jul. 18 1006 590 760 340 20 2716 Aug.18 910 600 720 320 31 2581 Sep. 18 803 670 660 313 30 2476 Okt. 18 730 630 630 290 37 2317 Nov.18 699 710 603 280 32 2324 Dez. 18 647 570 570 260 33 2080 Jn. 19 730 650 500 287 35 2202 Feb. 19 930 680 590 290 50 2540 Mr. 19 1160 724 620 300 63 2867 Apr. 19 1510 730 730 310 68 3348 Mai. 19 1650 760 740 330 70 3550 Jun. 19 1490 800 720 340 82 3432 Jul. 19 1460 840 670 350 80 3400 Aug.19 1390 830 610 341 90 3261 Sep. 19 1360 820 599 330 100 3209 Okt. 19 Nov.19 Dez. 19 Jn.20 Feb.20 Mr 20 Apr.20 Mai.20 Jun.20 Jul.20 Aug.20 Sep.20 Okt. 20 Nov.20 Dez.20 1340 1240 1103 1250 1550 1820 2010 2230 2490 2440 2334 2190 2080 2050 2004 810 827 750 780 805 830 890 930 980 1002 970 960 930 920 902 560 550 520 480 523 560 570 590 600 580 570 550 530 517 490 320 300 290 200 210 220 230 253 270 280 250 230 220 190 190 102 110 114 111 121 123 120 130 136 134 132 137 130 139 131 3132 3027 2777 2821 3209 3553 3820 4133 4476 4436 4256 4067 3890 3816 3717 DATA SHEET: IND DATA SHEET : INDUSTRY MOWER TOTAL SALES Month NA SA Eur Pac China World Jan-16 60000 571 13091 1045 0 74662 Feb-16 77184 611 17679 1111 0 96585 Mar-16 77885 658 22759 1068 0102369 Apr-16 86190 778 27966 1237 0 116171 May-16 96117 886 27895 1313 0 126210 Jun-16 97143 882 30566 1176 0 129768 Jul-16 84757 848 29444 1359 0 116409 Aug-16 79804 735 28364 1238 0 110141 Sep-16 64800 657 28393 1215 0 95065 Oct-16 59307 595 24444 1154 0 85500 Nov-16 52157 553 18000 1262 071972 Dec-16 45049 462 12453 1386 059349 Jan-17 58627 553 12778 1443 0 73401 Feb-17 76200 615 18214 1515 096545 Mar-17 82871 658 23889 1373 0 108791 Apr-17 84904 784 29455 1442 0 116584 May-17 93100 846 29464 1215 0 124625 Jun-17 93000 838 27414 1333 0 122585 Jul-17 83048 763 27368 1415 0 112594 Aug-17 74854 694 27321 1296 0 104164 Sep-17 60769 625 29444 1402 092241 Oct-17 55619 610 23774 1468 0 81470 Nov-17 48155 571 17308 1351 0 67386 Dec-17 42647 512 12941 1389 0 57489 Jan-18 57885 537 10962 1509 0 70892 Feb-18 77647 595 15273 1402 094917 Mar-18 81845 659 20556 1524 0 104583 Apr-18 86095 756 26786 1574 0 115211 May-18 91776 878 24828 1468 0 118949 Jun-18 100680 825 24737 1560 0 127801 Jul-18 86190 756 24828 1441 0 113216 Aug-18 71887 714 25179 1545 0 99325 Sep-18 60000 651 24545 1667 0 86863 Oct-18 55566 643 19286 1698 0 77193 Nov-18 50857 619 15273 1810 0 68558 Dec-18 42596 548 9107 1731 0 53982 Jan-19 58095 581 8571 1887 0 69135 Feb-19 75566 614 13158 1845 091182 Mar-19 80286 622 19655 1923 0 102486 Apr-19 85140 727 25179 1981 125 113027 May-19 90093 826 23103 1810 142 115832 Jun-19 95472 783 24286 1942 226 122482 Jul-19 87308 681 24737 1961 230 114686 Aug-19 74476 646 26607 2000 122 103729 Sep-19 61698 625 22982 2075 56 87381 Oct-19 57238 617 16897 2019 10 76771 Nov-19 50673 587 13750 2095 067105 Dec-19 51238 591 7818 2150 0 61797 Jan-20 59712 563 7547 1852 069673 Feb-20 77961 571 13889 1743 0 94165 Mar-20 83725 625 18302 1892 0 104544 Apr-20 90297 723 25192 2037 236 118250 May-20 91143 848 24706 1887 542 118583 Jun-20 99320 792 25306 1944 875 127363 Jul-20 93922 745 27083 2170 1386 123919 Aug-20 73143 739 26042 2037 1193 101961 Sep-20 66699 667 26304 2020 421 95688 Oct-20 56476 660 22558 2072 56 81766 Nov-20 51068 625 14773 2182 C 68648 Dec-20 46893 608 6977 2035 0 56510 Totals 1810 Datasheet: Tractor Unit Sales Month NA SA Eur Pacific China World Jn. 16 570 250 560 212 0 1592 Feb.16 611 270 600 230 0 1711 Mr. 16 630 260 680 240 0 Apr. 16 684 270 650 263 0 1867 Mai.16 650 280 580 269 0 1779 Jun. 16 600 270 590 280 0 1740 Jul. 16 512 264 760 290 0 1826 Aug. 16 500 280 645 270 0 1695 Sep. 16 478 290 650 263 0 1681 Okt. 16 455 280 670 258 0 1663 Nov.16 407 290 888 240 0 1825 Dez. 16 360 280 850 230 0 1720 Jn. 17 571 320 620 250 0 1761 Feb. 17 650 350 760 275 0 2035 Mr. 17 740 390 742 270 0 2142 Apr. 17 840 440 780 280 0 2340 Mai. 17 830 470 690 290 0 2280 Jun. 17 760 490 721 300 0 2271 Jul. 17 681 481 680 312 0 2154 Aug. 17 670 460 711 305 0 2146 Sep. 17 640 460 695 290 0 2085 Okt. 17 620 440 650 260 0 1970 Nov. 17 570 436 680 250 0 1936 Dez. 17 533 420 657 240 0 1850 Jan. 18 620 510 610 250 10 2000 Feb.18 792 590 680 250 12 2324 Mr. 18 890 610 730 260 20 2510 Apr. 18 960 600 820 270 22 2672 Mai. 18 1040 620 810 290 20 2780 Jun. 18 1032 640 807 310 24 2813 Jul. 18 1006 590 760 340 20 2716 Aug.18 910 600 720 320 31 2581 Sep. 18 803 670 660 313 30 2476 Okt. 18 730 630 630 290 37 2317 Nov.18 699 710 603 280 32 2324 Dez. 18 647 570 570 260 33 2080 Jn. 19 730 650 500 287 35 2202 Feb. 19 930 680 590 290 50 2540 Mr. 19 1160 724 620 300 63 2867 Apr. 19 1510 730 730 310 68 3348 Mai. 19 1650 760 740 330 70 3550 Jun. 19 1490 800 720 340 82 3432 Jul. 19 1460 840 670 350 80 3400 Aug.19 1390 830 610 341 90 3261 Sep. 19 1360 820 599 330 100 3209 Okt. 19 Nov.19 Dez. 19 Jn.20 Feb.20 Mr 20 Apr.20 Mai.20 Jun.20 Jul.20 Aug.20 Sep.20 Okt. 20 Nov.20 Dez.20 1340 1240 1103 1250 1550 1820 2010 2230 2490 2440 2334 2190 2080 2050 2004 810 827 750 780 805 830 890 930 980 1002 970 960 930 920 902 560 550 520 480 523 560 570 590 600 580 570 550 530 517 490 320 300 290 200 210 220 230 253 270 280 250 230 220 190 190 102 110 114 111 121 123 120 130 136 134 132 137 130 139 131 3132 3027 2777 2821 3209 3553 3820 4133 4476 4436 4256 4067 3890 3816 3717Step by Step Solution
There are 3 Steps involved in it

Get step-by-step solutions from verified subject matter experts