

Question: Create a box-and-whisker plot that represents the data in the table. The hourly earnings (in dollars) of a sample of 25 railroad equipment manufacturers
Create a box-and-whisker plot that represents the data in the table.
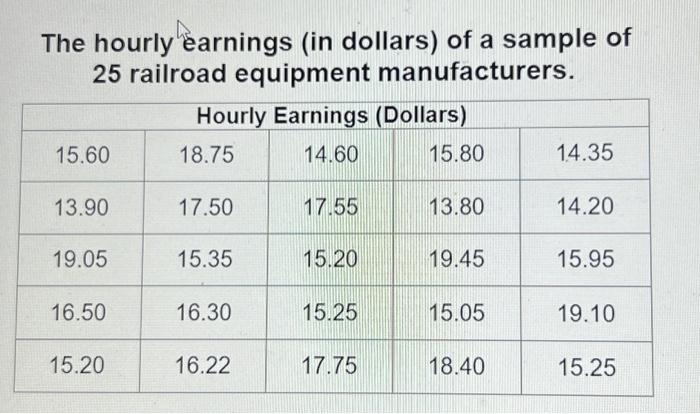
The hourly earnings (in dollars) of a sample of 25 railroad equipment manufacturers
Step by Step Solution
There are 3 Steps involved in it
1 Expert Approved Answer
Step: 1 Unlock

Question Has Been Solved by an Expert!
Get step-by-step solutions from verified subject matter experts
Step: 2 Unlock
Step: 3 Unlock