

Question: Create a chart that captures the EPS for each scenario by financing option. What conclusions can you draw from your chart about the changes on
Create a chart that captures the EPS for each scenario by financing option. What conclusions can you draw from your chart about the changes on EPS based on the following changes in:
Interest rate
Corporate rate
Stock price
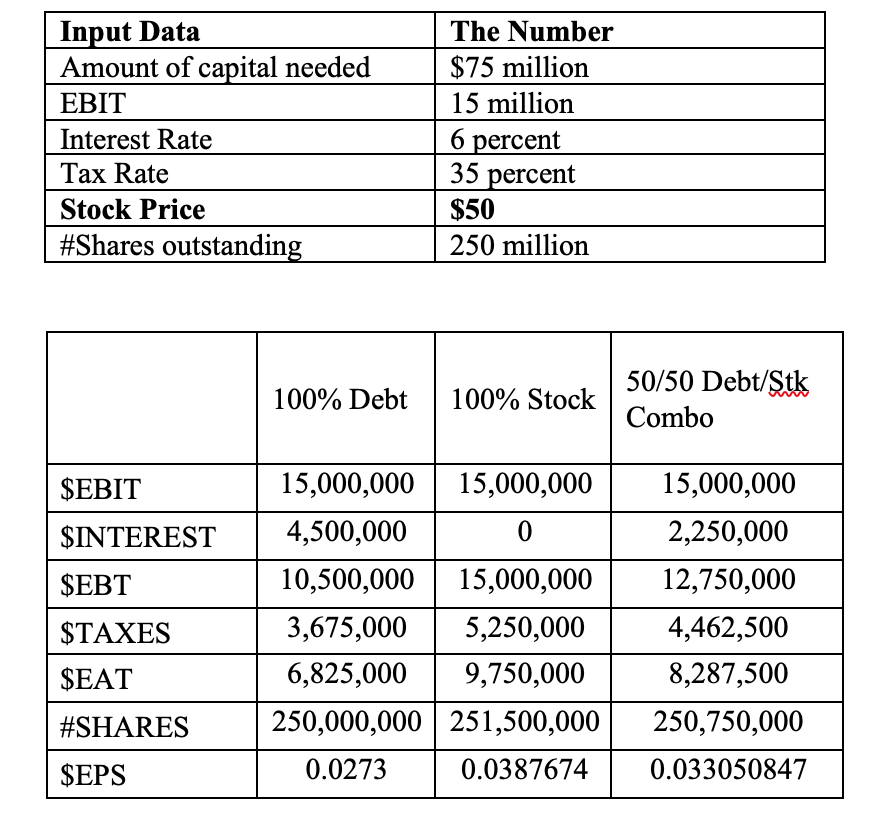
Input Data Amount of capital needed EBIT Interest Rate Tax Rate Stock Price #Shares outstandin The Number $75 million 15 million 6 percent 35 percent S50 250 million 50/50 Debt/Stk 100% Debt | 100% Stock SEBIT SINTEREST 4,500,000 SEBT STAXES SEAT #SHARES | 250,000,000 | 251 SEPS 15,000,00015,000,00015,000,000 2,250,000 50,000 4,462,500 8,287,500 10,500,00015,000,00012,7 3,675,0005,250,000 6,825,0009,750,000 ,500,000250,750,000 0.03876740.033050847 0.0273
Step by Step Solution
There are 3 Steps involved in it

Get step-by-step solutions from verified subject matter experts