

Question: Create a code to plot the given functions in MATLAB and EXPLAIN Appropriately label the x-, y- axes and title of the graph. PLEASE EXPLAIN
Create a code to plot the given functions in MATLAB and EXPLAIN Appropriately label the x-, y- axes and title of the graph.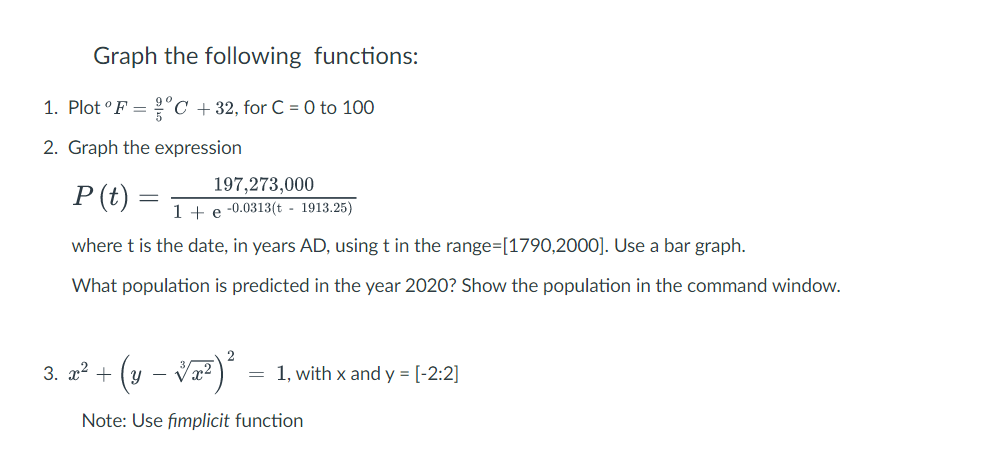
PLEASE EXPLAIN THE CODES
Graph the following functions: 1. Plot oF=59C+32, for C=0 to 100 2. Graph the expression P(t)=1+e0.0313(t1913.25)197,273,000 where t is the date, in years AD, using t in the range =[1790,2000]. Use a bar graph. What population is predicted in the year 2020? Show the population in the command window. 3. x2+(y3x2)2=1, with x and y=[2:2] Note: Use fimplicit function
Step by Step Solution
There are 3 Steps involved in it
1 Expert Approved Answer
Step: 1 Unlock

Question Has Been Solved by an Expert!
Get step-by-step solutions from verified subject matter experts
Step: 2 Unlock
Step: 3 Unlock