

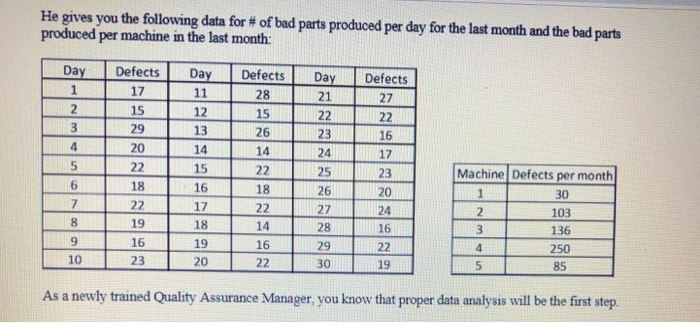
Question: Create a control chart of appropriate data , you must show your calculations and do not round up or down? Show to two decimals points?(00.00).
 Create a control chart of appropriate data , you must show your calculations and do not round up or down? Show to two decimals points?(00.00).
Step by Step Solution
There are 3 Steps involved in it
1 Expert Approved Answer
Step: 1 Unlock

Question Has Been Solved by an Expert!
Get step-by-step solutions from verified subject matter experts
Step: 2 Unlock
Step: 3 Unlock