Question: create a control chart with thr information provided. list the mean and values for 3 standard deviations above and below the average. describe what the

create a control chart with thr information provided.
list the mean and values for 3 standard deviations above and below the average.
describe what the data tells you create a control chart with thr information
Shift no. 13.2 Control Charts for Groups of Data Table 13.2.1: The Thickness of Paint on Refrigerators for Five Refrigerators from Each Shift (Subgroup) Subgroup Thickness (in mm) Mean Range Std Dev. 1 2.7 2.3 2.6 2.4 2.7 2.54 0.4 .1817 2 2.6 2.4 2.6 2.3 2.8 2.54 0.5 .1949 3 2.3 2.3 2.4 2.5 2.4 2.38 0.2 .0837 4 2.8 2.3 2.4 2.6 2.7 2.56 0.5 .2074 5 2.6 2.5 2.6 2.1 2.8 2.52 0.7 .2588 6 2.2 2.3 2.7 2.2 2.6 2.40 0.5 .2345 7 2.2 2.6 2.4 2.0 2.3 2.30 0.6 .2236 8 2.8 2.6 2.6 2.7 2.5 2.64 0.3 .1140 9 2.4 2.8 2.4 2.2 2.3 2.42 0.6 .2280 10 2.6 2.3 2.0 2.5 2.4 2.36 0.6 .2302 11 3.1 3.0 3.5 2.8 3.0 3.08 0.7 .2588 12 2.4 2.8 2.2 2.9 2.5 2.56 0.7 .2881 13 2.1 3.2 2.5 2.6 2.8 2.64 1.1 .4037 14 2.2 2.8 2.1 2.2 2.4 2.34 0.7 .2793 15 2.4 3.0 2.5 2.5 2.0 2.48 1.0 .3564 16 3.1 2.6 2.6 2.8 2.1 2.64 1.0 .3647 17 2.9 2.4 2.9 1.3 1.8 2.26 1.6 .7021 18 1.9 1.6 2.6 3.3 3.3 2.54 .7829 19 2.3 2.6 2.7 2.8 3.2 2.72 0.9 .3271 20 1.8 2.8 2.3 2.0 2.9 2.36 1.1 .4827 Column mean = 2.514 0.77 .3101 1.7 ing the control chart template in our modulo create a control chart using the mean values of the shift

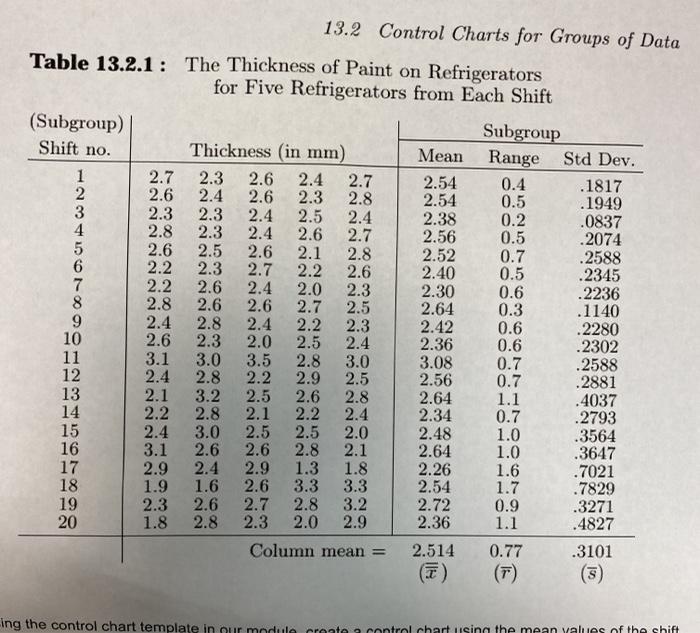
Step by Step Solution

There are 3 Steps involved in it

1 Expert Approved Answer
Step: 1 Unlock blur-text-image
Question Has Been Solved by an Expert!

Get step-by-step solutions from verified subject matter experts

Step: 2 Unlock
Step: 3 Unlock

Students Have Also Explored These Related General Management Questions!