

Question: create a correlation table of the 6 varibles and construct 2 scatter plots? due by sunday 11:59 pm Consider the (fictional) data in the file
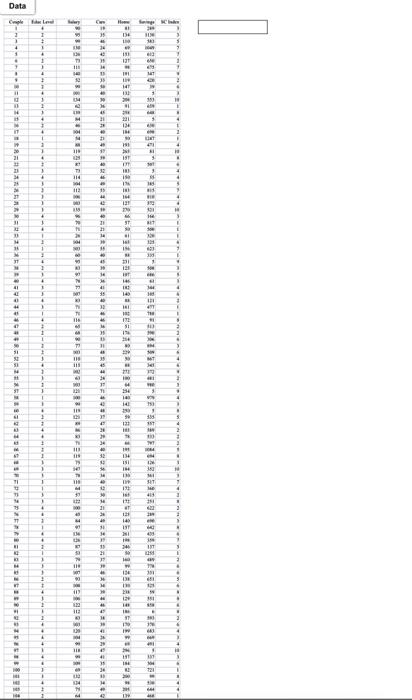
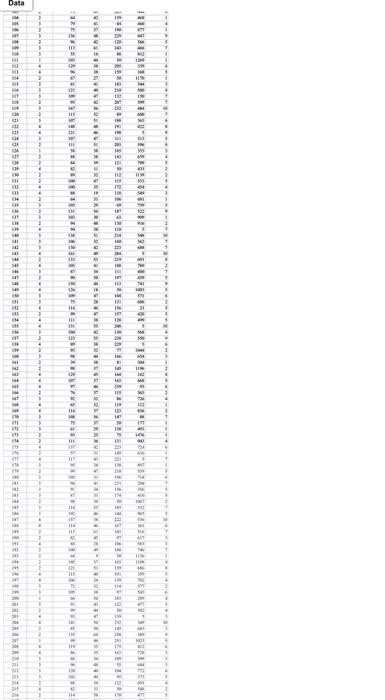
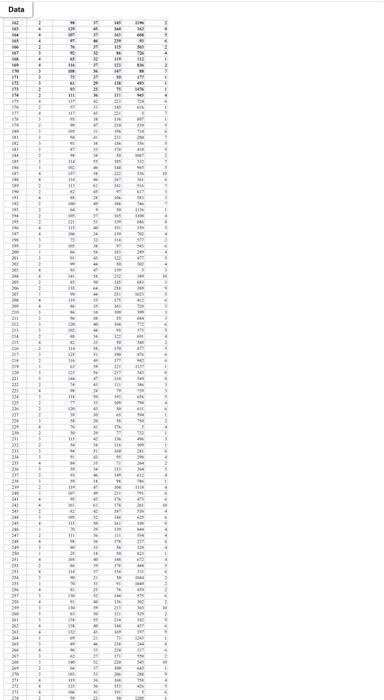
Consider the (fictional) data in the file C03_02.xlsx. For several hundred couples, it lists their education level, their annual combined salary, the market value of their home and cars, the amount of savings they have accumulated (in savings accounts, stocks, retirement accounts, and so on), and a self-reported "social climber index" on a scale of 1 to 10 (with 1 being very unconcerned about social status and material items and 10 being very concerned about these). Prepare a report based on these data, supported by relevant charts and/or tables, that could be used in a book such as The Millionaire Next Door. Your conclusions can either support or contradict those of Stanley and Danko. 1. Create a correlation (see section 3-4b from your textbook) table of the 6 variables (don't include couple). You can use Excel Data Analysis ToolPak to perform this procedure (see Module 2: Video_chapter 3) 2. Construct 2 scatter plots: (a) savings vs. salary, and (b) SC index vs salary. How are they related? Make sure to interpret your findings. Data C . 1 + 1 35 I 1 NIE 10 5 + 10 1 1 . Tu 10 18! ILI CI ve 1 1 11 18 DF 3 11 7 141 . TE E IN 11 04 18 1 3 1 + + . M 2 1 9 I 1 18 21 TE 1 PS 1 1 1 . w ! 10 118 4 F IL 151 . . 1 TU CE THI SI PI! 41 . 9 14 112 15 1 18 11 FIE 18 PE 21 3 4 131 18 41 1 + 1 1 3 40 21 ST LIE 11 TE IL 1 1 + h so 1 st 1 1 19 HT . 16 18 IM 1 3 PE 11 1 IP 190 10 . N 41 1 1 w IP SF 181 14 . 3 + . 11 LP IF TE 11 18 IVE To 1 1 . 911 16 F 3 1 4 1 21 1 1 . 15 UP 1 11 MT 29 45 15 + 1 48 1 IT LI 30 17 1 1 7 51 54 F 1 1 4 1 14 20 11 # 19 REF 6 I INT 7 4 + 20 KET. 3 2 AL 1 w 1 LI! 11 118 CF T! IS R1 1 H 1 1 1 TE! IL 11 . II LIE . FIP 4 F E 111 11 21 OF 121 I 161 >> 16 1 . . . 1 HP WE LII 18 1 21 19 7 3 . 11 w w H M 11 1 18 3 . + I CI! 21 IN . 112 CP 141 1 ST 1 T # 10 . NE ! 2 18 w 41 4 HE HIE 49 4 191 111 SE 781 TH 1 . CT MES N 4 4 Data 11 - . . w . 15 1 - im . . 1 11 w 10 1 7 CH! 11 11 4 2 # 1 FEE WI ON . 3 SH IT . INCHI 1 N 1 IH TH . 011 - IT 11 . . 11 - 54 I + . 11 10 - 1 1 111 . - . 41 NI + 11 E 11 11 ++ . !! - HE HI IN - CI TV - 11 55:Ex; EST # FE 115 Data 232323 FLEREEEE 22 EYLE Consider the (fictional) data in the file C03_02.xlsx. For several hundred couples, it lists their education level, their annual combined salary, the market value of their home and cars, the amount of savings they have accumulated (in savings accounts, stocks, retirement accounts, and so on), and a self-reported "social climber index" on a scale of 1 to 10 (with 1 being very unconcerned about social status and material items and 10 being very concerned about these). Prepare a report based on these data, supported by relevant charts and/or tables, that could be used in a book such as The Millionaire Next Door. Your conclusions can either support or contradict those of Stanley and Danko. 1. Create a correlation (see section 3-4b from your textbook) table of the 6 variables (don't include couple). You can use Excel Data Analysis ToolPak to perform this procedure (see Module 2: Video_chapter 3) 2. Construct 2 scatter plots: (a) savings vs. salary, and (b) SC index vs salary. How are they related? Make sure to interpret your findings. Data C . 1 + 1 35 I 1 NIE 10 5 + 10 1 1 . Tu 10 18! ILI CI ve 1 1 11 18 DF 3 11 7 141 . TE E IN 11 04 18 1 3 1 + + . M 2 1 9 I 1 18 21 TE 1 PS 1 1 1 . w ! 10 118 4 F IL 151 . . 1 TU CE THI SI PI! 41 . 9 14 112 15 1 18 11 FIE 18 PE 21 3 4 131 18 41 1 + 1 1 3 40 21 ST LIE 11 TE IL 1 1 + h so 1 st 1 1 19 HT . 16 18 IM 1 3 PE 11 1 IP 190 10 . N 41 1 1 w IP SF 181 14 . 3 + . 11 LP IF TE 11 18 IVE To 1 1 . 911 16 F 3 1 4 1 21 1 1 . 15 UP 1 11 MT 29 45 15 + 1 48 1 IT LI 30 17 1 1 7 51 54 F 1 1 4 1 14 20 11 # 19 REF 6 I INT 7 4 + 20 KET. 3 2 AL 1 w 1 LI! 11 118 CF T! IS R1 1 H 1 1 1 TE! IL 11 . II LIE . FIP 4 F E 111 11 21 OF 121 I 161 >> 16 1 . . . 1 HP WE LII 18 1 21 19 7 3 . 11 w w H M 11 1 18 3 . + I CI! 21 IN . 112 CP 141 1 ST 1 T # 10 . NE ! 2 18 w 41 4 HE HIE 49 4 191 111 SE 781 TH 1 . CT MES N 4 4 Data 11 - . . w . 15 1 - im . . 1 11 w 10 1 7 CH! 11 11 4 2 # 1 FEE WI ON . 3 SH IT . INCHI 1 N 1 IH TH . 011 - IT 11 . . 11 - 54 I + . 11 10 - 1 1 111 . - . 41 NI + 11 E 11 11 ++ . !! - HE HI IN - CI TV - 11 55:Ex; EST # FE 115 Data 232323 FLEREEEE 22 EYLE
Step by Step Solution
There are 3 Steps involved in it

Get step-by-step solutions from verified subject matter experts