

Question: create a dataframe for 1987 and draw the world map colors by life expectency at birth. fix the color range so that comparasons are possible.
create a dataframe for 1987 and draw the world map colors by life expectency at birth. fix the color range so that comparasons are possible.
thank you! 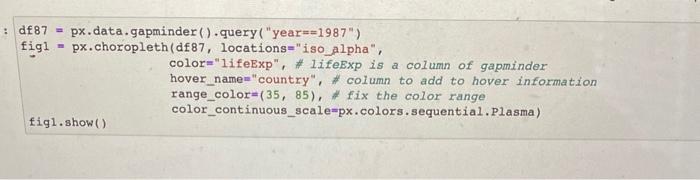
Step by Step Solution
There are 3 Steps involved in it
1 Expert Approved Answer
Step: 1 Unlock

Question Has Been Solved by an Expert!
Get step-by-step solutions from verified subject matter experts
Step: 2 Unlock
Step: 3 Unlock