

Question: Create a document that explains how you cleaned, organized, and explored the strawberry data, preparing the data for analysis. Explain what you found. Consider using
Create a document that explains how you cleaned, organized, and explored the strawberry data, preparing the data for analysis. Explain what you found. Consider using plots, tables, and drawings to make your description clear. Your code should be wellorganized and annotated. Explain terms and units of measure that may not be familiar to the reader. Point out any inconsistencies and anomalies. List questions you have about the data.
Your GitHub should contain your prepared document pdf and qmd and the readyforanalysis data file. Deliver your document and the data as two separate files that can be read into R
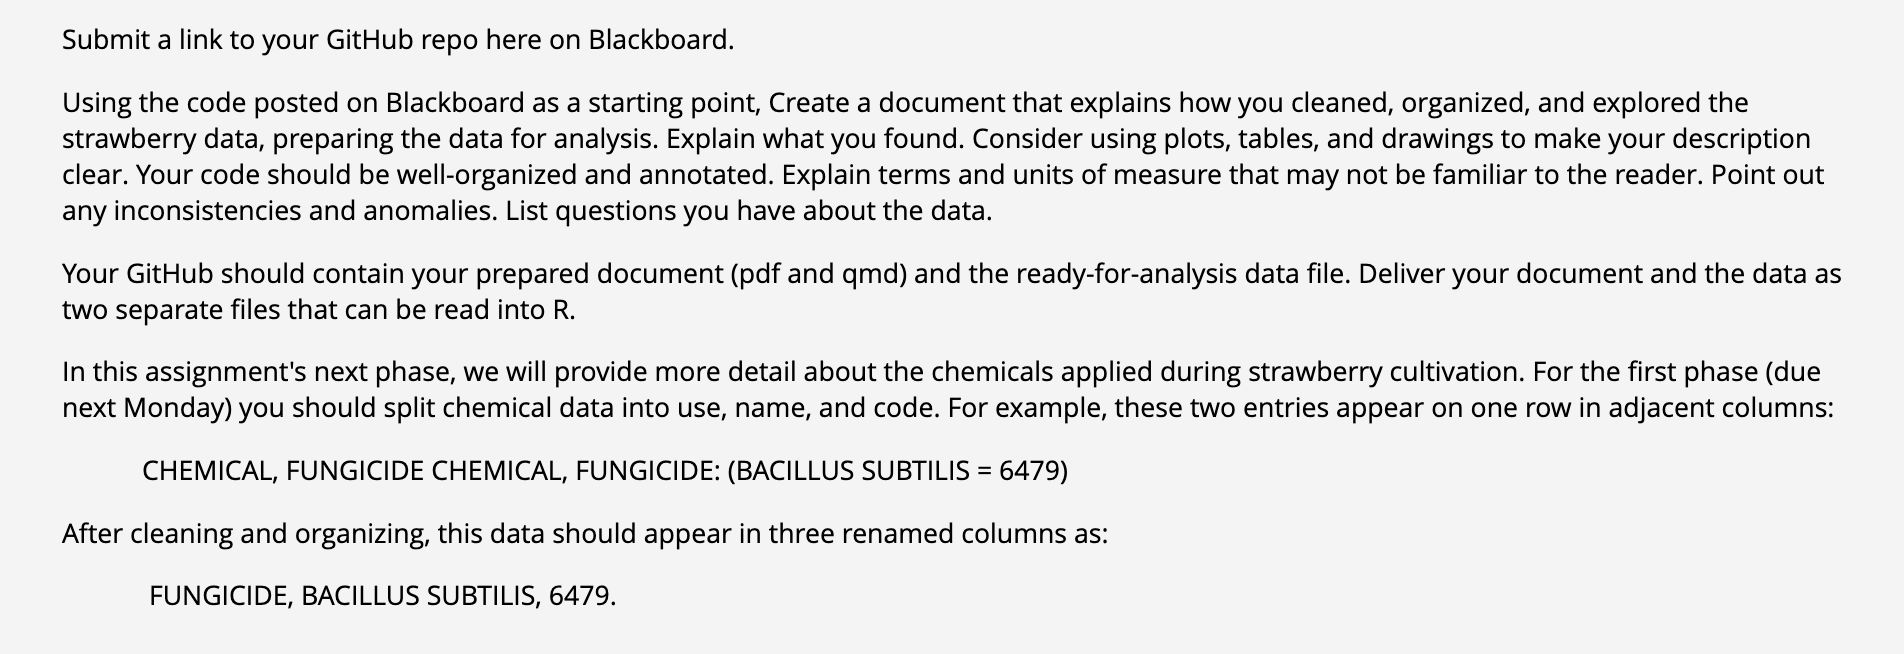
In this assignment's next phase, we will provide more detail about the chemicals applied during strawberry cultivation. For the first phase due next Monday you should split chemical data into use, name, and code. For example, these two entries appear on one row in adjacent columns:
CHEMICAL, FUNGICIDE CHEMICAL, FUNGICIDE: BACILLUS SUBTILIS
After cleaning and organizing, this data should appear in three renamed columns as:
FUNGICIDE, BACILLUS SUBTILIS,
Step by Step Solution
There are 3 Steps involved in it
1 Expert Approved Answer
Step: 1 Unlock

Question Has Been Solved by an Expert!
Get step-by-step solutions from verified subject matter experts
Step: 2 Unlock
Step: 3 Unlock