Question: Create a flow chart . The example how it should look like is below. You may pick any topic to create a flow chart. Thank
Create a flow chart . The example how it should look like is below. You may pick any topic to create a flow chart. Thank you
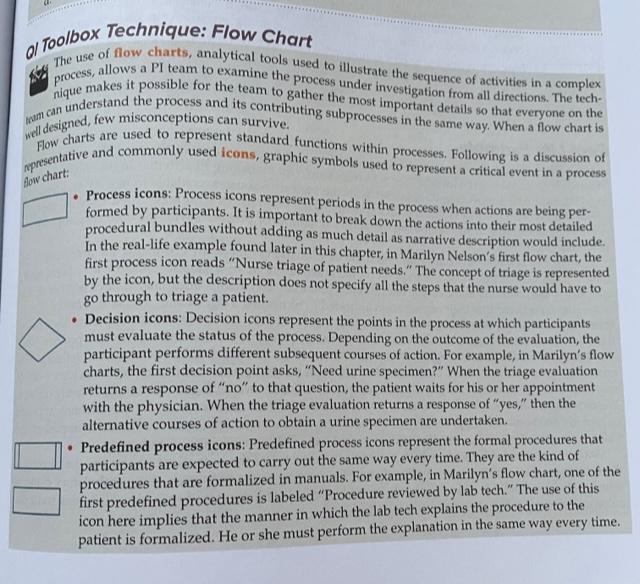
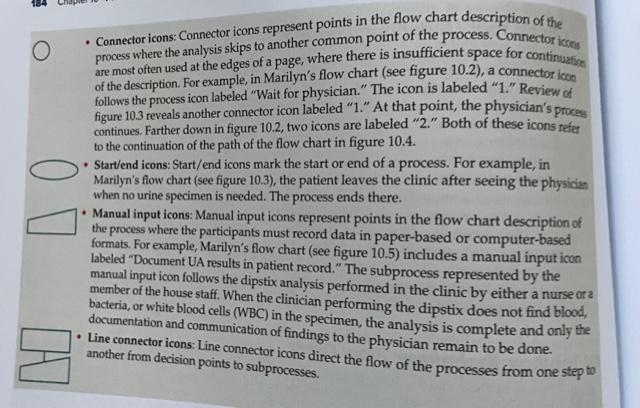
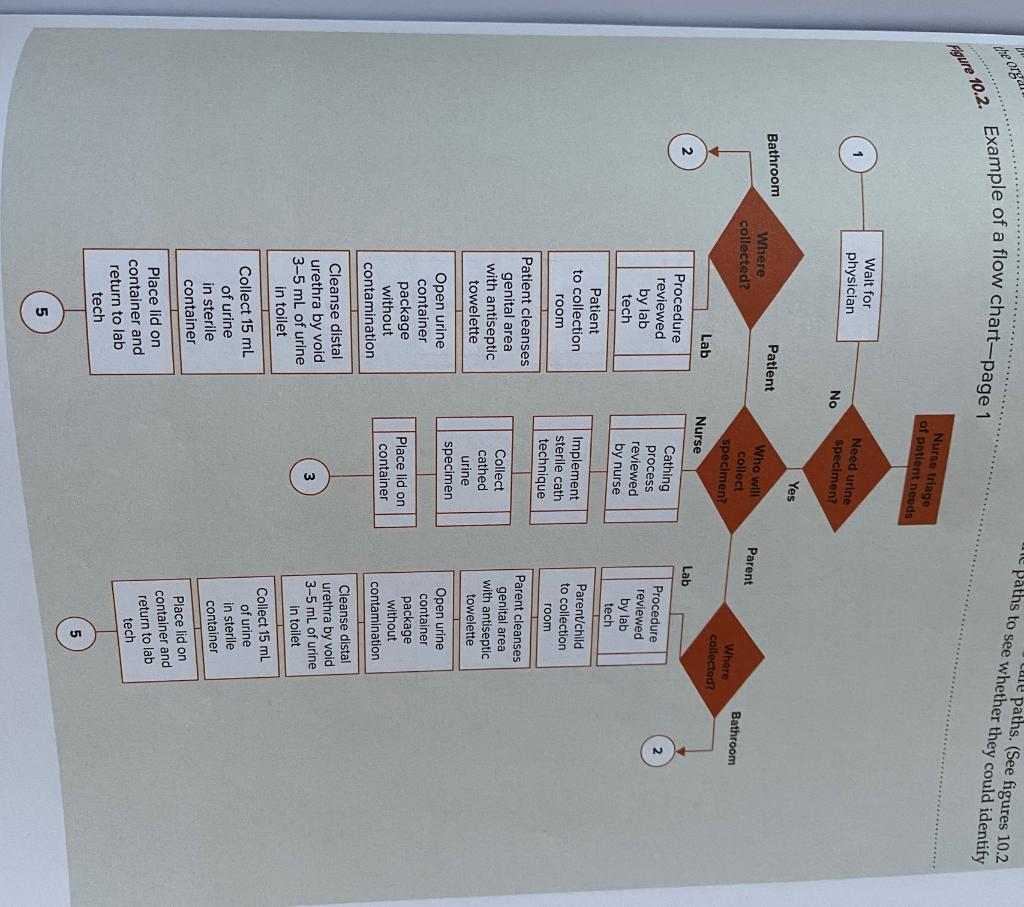
slow chart: . al Toolbox Technique: Flow Chart The use of flow charts, analytical tools used to illustrate the sequence of activities in a complex nique makes it possible for the team to gather the most important details so that everyone on the process, allows a PI team to examine the process under investigation from all directions. The tech- Am can understand the process and its contributing subprocesses in the same way. When a flow chart is well designed, few misconceptions can survive. presentative and commonly used icons, graphic symbols used to represent a critical event in a process Flow charts are used to represent standard functions within processes. Following is a discussion of Process icons: Process icons represent periods in the process when actions are being per: formed by participants. It is important to break down the actions into their most detailed procedural bundles without adding as much detail as narrative description would include In the real-life example found later in this chapter, in Marilyn Nelson's first flow chart, the first process icon reads "Nurse triage of patient needs." The concept of triage is represented by the icon, but the description does not specify all the steps that the nurse would have to go through to triage a patient. Decision icons: Decision icons represent the points in the process at which participants must evaluate the status of the process. Depending on the outcome of the evaluation, the participant performs different subsequent courses of action. For example, in Marilyn's flow charts, the first decision point asks "Need urine specimen?" When the triage evaluation returns a response of "no" to that question, the patient waits for his or her appointment with the physician. When the triage evaluation returns a response of "yes," then the alternative courses of action to obtain a urine specimen are undertaken. Predefined process icons: Predefined process icons represent the formal procedures that participants are expected to carry out the same way every time. They are the kind of procedures that are formalized in manuals. For example, in Marilyn's flow chart, one of the first predefined procedures is labeled "Procedure reviewed by lab tech." The use of this icon here implies that the manner in which the lab tech explains the procedure to the patient is formalized. He or she must perform the explanation in the same way every time. O Connector icons: Connector icons represent points in the flow chart description of the process where the analysis skips to another common point of the process. Connector icons are most often used at the edges of a page, where there is insufficient space for continuation of the description. For example, in Marilyn's flow chart (see figure 10.2), a connector icon follows the process icon labeled "Wait for physician,". The icon is labeled "1." Review of figure 103 reveals another connector icon labeled "1" At that point, the physician's process continues. Farther down in figure 10.2, two icons are labeled "2." Both of these icons refer to the continuation of the path of the flow chart in figure 10.4. Start/end icons: Start/end icons mark the start or end of a process. For example, in Marilyn's flow chart (see figure 10.3), the patient leaves the clinic after seeing the physician when no urine specimen is needed. The process ends there. Manual input icons: Manual input icons represent points in the flow chart description of the process where the participants must record data in paper-based or computer-based formats. For example, Marilyn's flow chart (see figure 10.5) includes a manual input icon labeled "Document UA results in patient record." The subprocess represented by the manual input icon follows the dipstix analysis performed in the clinic by either a nurse ora member of the house staff. When the clinician performing the dipstix does not find blood, bacteria, or white blood cells (WBC) in the specimen, the analysis is complete and only the documentation and communication of findings to the physician remain to be done. Line connector icons: Line connector icons direct the flow of the processes from one step another from decision points to subprocesses. to ale paths. (See figures 10.2 ne paths to see whether they could identify the orgd! Figure 10.2. Example of a flow chart-page 1 Nurse triage of patient needs Wait for physician Need urine specimen? No Yes Bathroom Patient Where collected? Who will Parent Bathroom collect Specimen? Nurse Where collected? Lab 2 Lab Procedure reviewed by lab tech Cathing process reviewed by nurse Procedure reviewed by lab tech Patient to collection room Implement sterile cath technique Parent/child to collection room Patient cleanses genital area with antiseptic towelette Collect cathed urine specimen Parent cleanses genital area with antiseptic towelette Open urine container package without contamination Place lid on container Open urine container package without contamination Cleanse distal urethra by void 3-5 mL of urine in toilet W Cleanse distal urethra by void 3-5 mL of urine in toilet Collect 15 ml of urine in sterile container Collect 15 ml of urine in sterile container Place lid on container and return to lab tech Place lid on container and return to lab tech 5 5


