

Question: Create a function In matlab called plot _ quad that plots a quadratic equation. It has the following one input vector with 5 values (
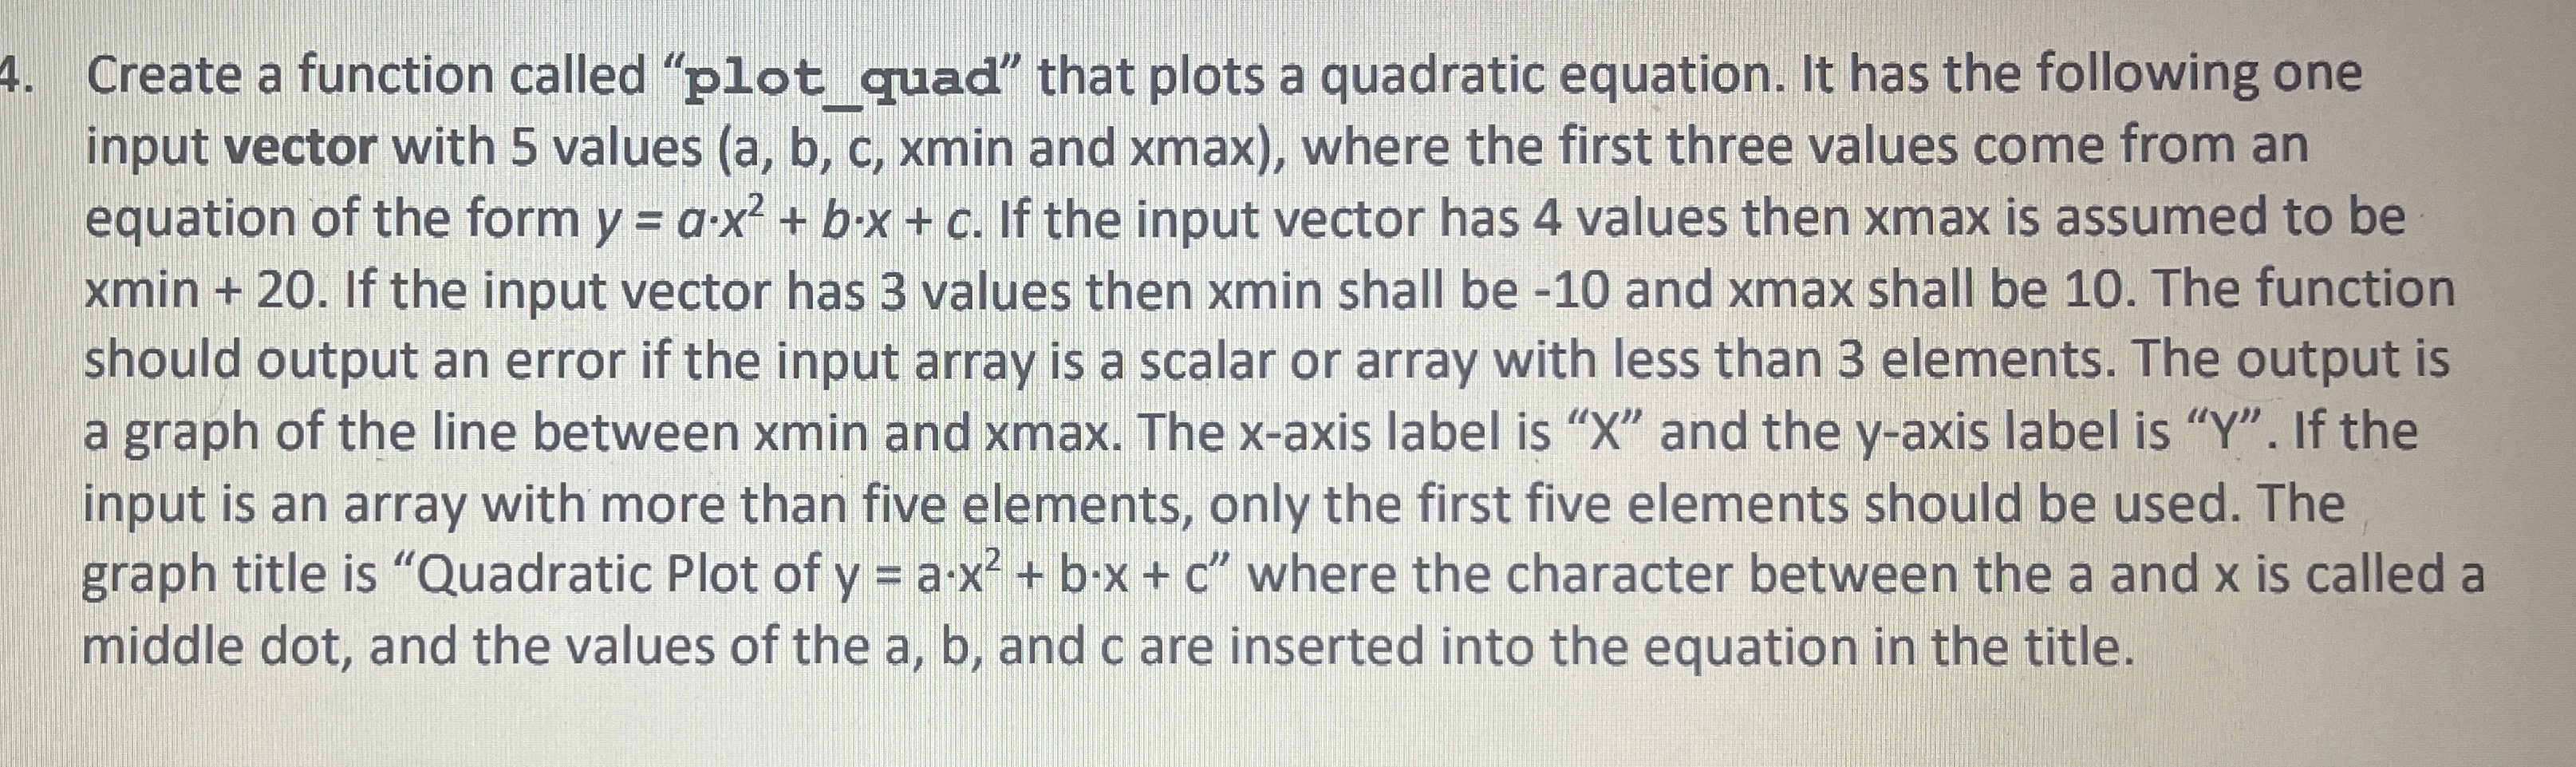
Create a function In matlab called "plotquad" that plots a quadratic equation. It has the following one input vector with values xmin and xmax where the first three values come from an equation of the form If the input vector has values then max is assumed to be
xmin If the input vector has values then xmin shall be and xmax shall be The function should output an error if the input array is a scalar or array with less than elements. The output is a graph of the line between xmin and xmax. The axis label is and the axis label is If the input is an array with more than five elements, only the first five elements should be used. The
graph title is "Quadratic Plot of where the character between the a and is called a
middle dot, and the values of the and are inserted into the equation in the title.
Step by Step Solution
There are 3 Steps involved in it
1 Expert Approved Answer
Step: 1 Unlock

Question Has Been Solved by an Expert!
Get step-by-step solutions from verified subject matter experts
Step: 2 Unlock
Step: 3 Unlock