

Question: Create a function that projects population based on static: Birth Rate (BR) Death Rate (DR) Migration will be represented as a pulse function starting at
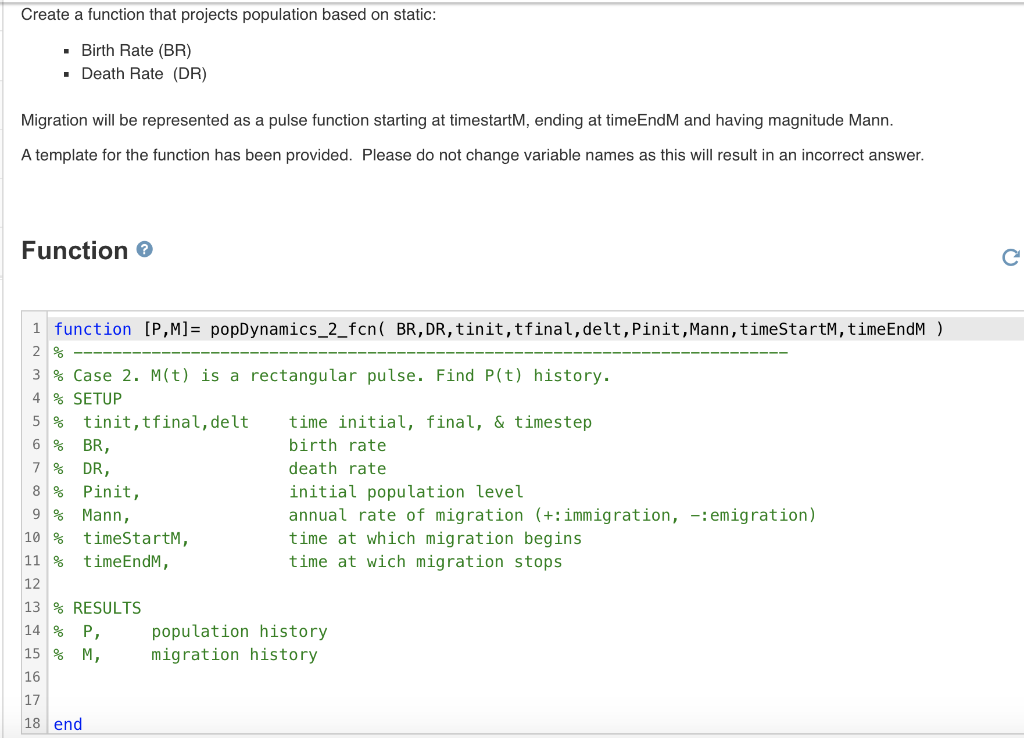
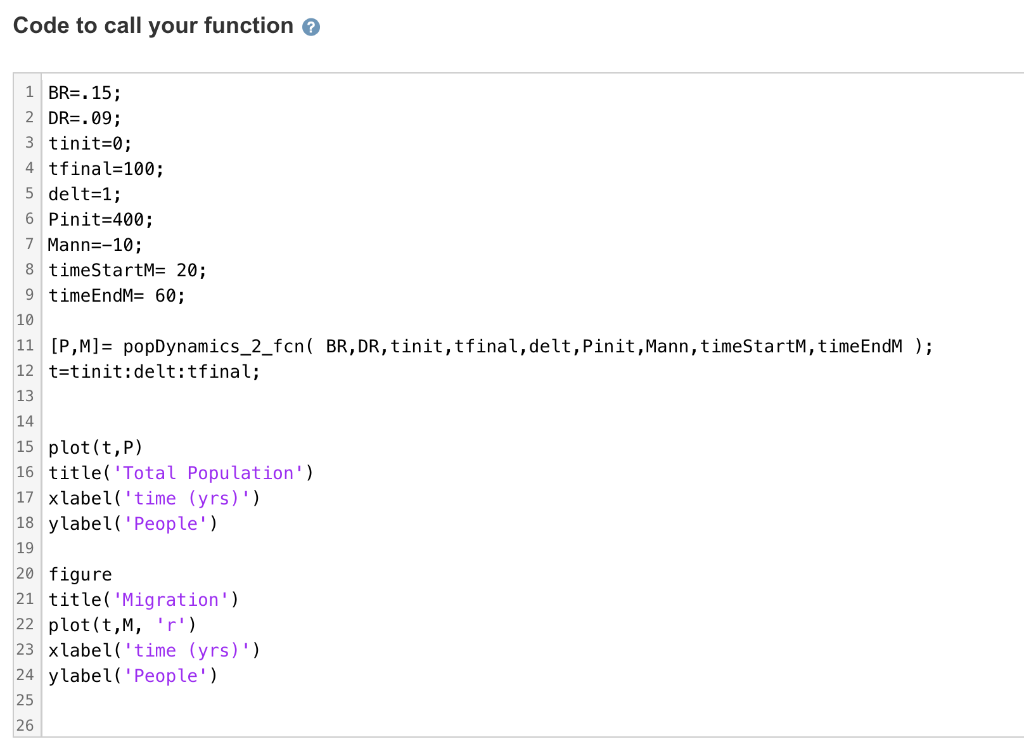
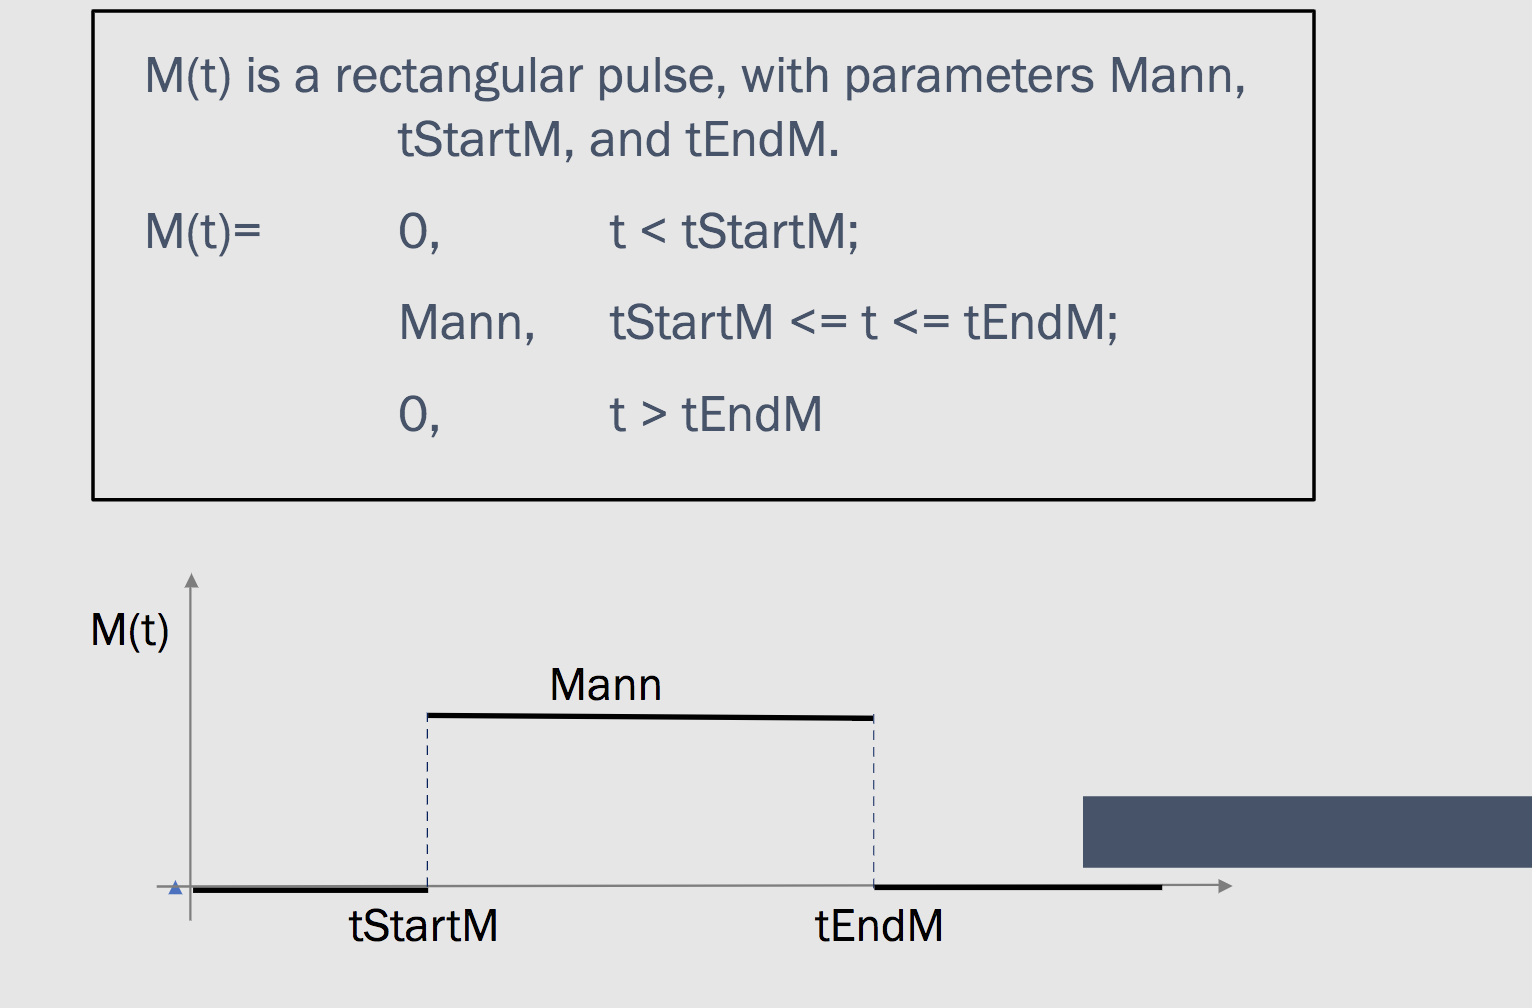
Create a function that projects population based on static: Birth Rate (BR) Death Rate (DR) Migration will be represented as a pulse function starting at timestartM, ending at timeEndM and having magnitude Mann. A template for the function has been provided. Please do not change variable names as this will result in an incorrect answer. Function 1 function [P,M]= popDynamics_2_fcn( BR, DR, tinit,tfinal, delt, Pinit, Mann, timeStartM, timeEndM ) 2 5 % 6 % 7 8 % 9 3 % Case 2. M(t) is a rectangular pulse. Find P(t) history. 4 % SETUP tinit,tfinal, delt time initial, final, & timestep BR, birth rate DR, death rate Pinit, initial population level % Mann, annual rate of migration (+: immigration, -: emigration) 10 % timeStartM, time at which migration begins 11 % timeEndM, time at wich migration stops 12 13 % RESULTS 14 % P, population history 15 % M, migration history 16 17 18 end Code to call your function 1 BR=. 15; 2 DR=.09; 3 tinit=0; 4 tfinal=100; 5 delt=1; 6 Pinit=400; 7 Mann=-10; 8 timeStartM= 20; 9 timeEndM= 60; 10 11 [P,M]= popDynamics_2_fon( BR, DR, tinit,tfinal, delt, Pinit, Mann, timeStartM, timeEndM); 12 t=tinit:delt:tfinal; 13 14 15 plot(t,P) 16 title('Total Population') 17 xlabel('time (yrs)') 18 ylabel('People') 19 20 figure 21 title('Migration') 22 plot(t,M, 'r') 23 xlabel('time (yrs)') 24 ylabel('People') 25 26 M(t) is a rectangular pulse, with parameters Mann, tStartM, and tEndM. M(t)= O t
Step by Step Solution
There are 3 Steps involved in it

Get step-by-step solutions from verified subject matter experts