

Question: Create a good scientific graph of the data from your class cheese experiment. Graph mass of cheese as the dependent variable Whey Group . Milk
Create a good scientific graph of the data from your class cheese experiment. Graph mass of cheese as the dependent variable
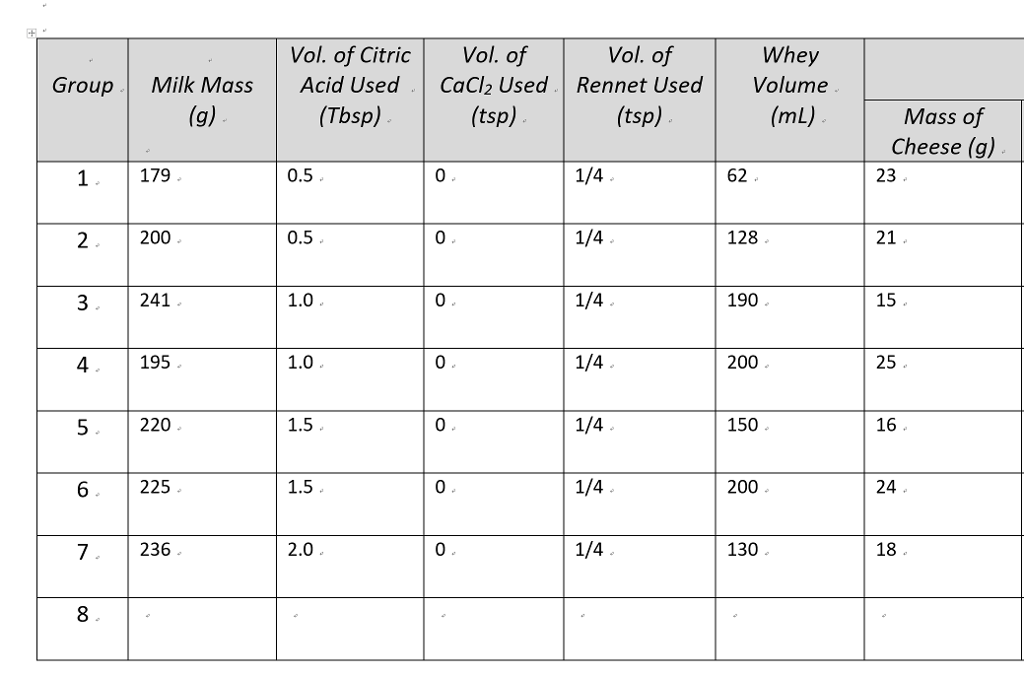
Whey Group . Milk Mass Acid Used CaCl2 Used. Rennet UsedVolume (mL) Vol. of Citric Vol. of Vol. of (Tbsp) (tsp) (tsp) Mass of Cheese (g,) 179. 0.5 0 1/4 62 23 2.200 0.5 0 1/4 128 21 241 1.0 0 190 15 4 195 1.0 0 200 25 220 1.5. 0 150 16 225 1.5 0 200 24 236 2.0 0 130 18 8 Whey Group . Milk Mass Acid Used CaCl2 Used. Rennet UsedVolume (mL) Vol. of Citric Vol. of Vol. of (Tbsp) (tsp) (tsp) Mass of Cheese (g,) 179. 0.5 0 1/4 62 23 2.200 0.5 0 1/4 128 21 241 1.0 0 190 15 4 195 1.0 0 200 25 220 1.5. 0 150 16 225 1.5 0 200 24 236 2.0 0 130 18 8
Step by Step Solution
There are 3 Steps involved in it

Get step-by-step solutions from verified subject matter experts