

Question: Create a Heatmap for Visualization Explanation: Develop a heatmap visualization that displays the assessed risks and their severity levels across different dimensions ( e .
Create a Heatmap for Visualization
Explanation:
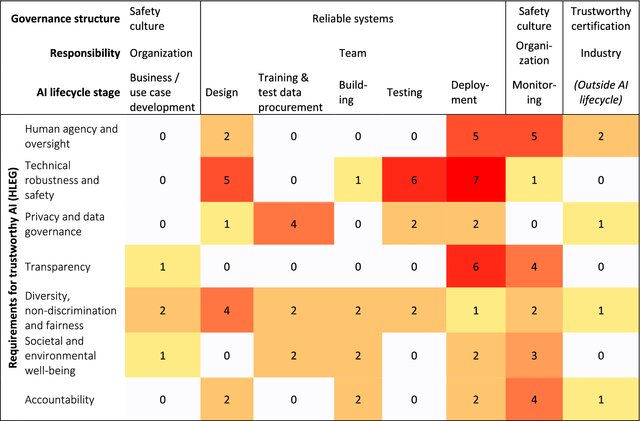
Develop a heatmap visualization that displays the assessed risks and their severity levels across different dimensions eg AI lifecycle phases, impact categories
Use a color scale to represent the severity of each risk, with darker colors indicating higher risk.
This visual representation will help stakeholders understand the overall risk landscape and prioritize mitigation efforts.
expandmore
Epsilon mu phi
u iota sigma eta pi rho chi epsi iota rho omega
u
expandmore
Absolutely! Let's create a heatmap to visualize the AI risks across the lifecycle phases and their broader impacts. Given that we have the data already categorized, we can use Python's Seaborn library to create the heatmap.
Python
import seaborn as sns
import matplotlib.pyplot as plt
import pandas as pd
# Create the DataFrame from the table data
data
'Risk Description':
'Unwanted Outputs, Literal Memory Bias',
'Lack of Quality, Factuality, Hallucinating',
'Lack of Timeliness',
'Lack of Reproducibility and Explainability',
'Lack of Security of Generated Code',
'Incorrect Response to Specific Inputs',
'Automation Bias',
'Susceptibility to Interpreting Text as Instruction',
'Lack of Confidentiality of Input Data',
'Selfreinforcing Impacts and Model Collapse',
'Dependence on the Model DeveloperOperator
'Misinformation Fake News:
'Social Engineering:
Reidentification of Individuals from Anonymous Data:
'Knowledge Gathering and Processing in the Context of Surveillance:
'Malware Creation and Improvement:
'Malware Placement:
'RCE Remote Code Execution attacks:
'Attackers can Reconstruct a Models Training Data:
'Model Subversion Attacks:
'Member Reasoning Attacks:
'Homograph Attacks',
'Prompt Injection Attacks:
'Data Poisoning Attacks:
'Model Poisoning Attacks:
'Learning Transfer Attacks:
'Environmental Impact:
'Economic Disruption:
'Overreliance and Dependency:
'Dual Use Concerns:
'Unforeseen Consequences:
'Planning':
'Data':
'Development':
'Operation':
df pdDataFramedata
# Create the heatmap using Seaborn
pltfigurefigsize
snssetfontscale # Adjust font size as needed
snsheatmapdfsetindexRisk Description'transpose cmap"YlOrRd", annotTrue, fmtd cbarkwslabel: 'Risk Presence'
plttitleAI System Lifecycle Risk Assessment Heatmap'
pltxlabelLifecycle Phase'
pltylabelImpact Category'
pltxticksrotation
pltshow
CREATE THE HEATMAP LIKE AS PHOTO
Step by Step Solution
There are 3 Steps involved in it
1 Expert Approved Answer
Step: 1 Unlock

Question Has Been Solved by an Expert!
Get step-by-step solutions from verified subject matter experts
Step: 2 Unlock
Step: 3 Unlock