

Question: Create a histogram for the variables fage, mage, weeks, gained, and tpounds. Describe the shape of the distribution, Is the mean or the median a
Create a histogram for the variables fage, mage, weeks, gained, and tpounds. Describe the shape of the distribution, Is the mean or the median a better measure of the center for each of the variables?
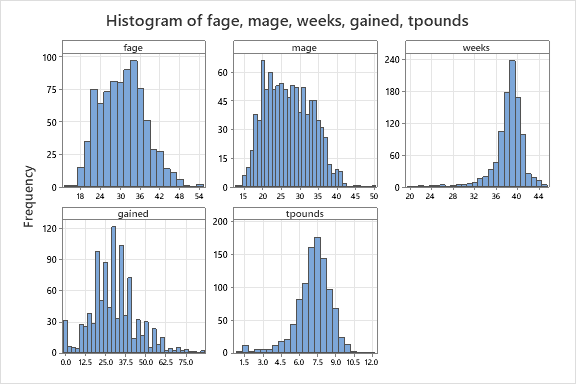
Histogram of fage, mage, weeks, gained, tpounds fage mage weeks 100 240 - 60 75 - 180 45 50 - 30 120 - 25 15 60 Frequency 18 24 30 36 42 48 54 15 20 25 30 35 40 45 50 20 24 28 32 36 40 44 gained tpounds 200 120 90 - 150 60 - 100 30 50 0 - 0 0.0 12.5 25.0 37.5 50.0 62.5 75.0 1.5 20 4.5 60 75 9.0 105 120
Step by Step Solution
There are 3 Steps involved in it
1 Expert Approved Answer
Step: 1 Unlock

Question Has Been Solved by an Expert!
Get step-by-step solutions from verified subject matter experts
Step: 2 Unlock
Step: 3 Unlock