

Question: Create a histogram for variable Ageas shown below. Comment on the skewness of the distribution. (Hint: geom_histogram(): to draw histogram, theme_bw(): black and white theme,
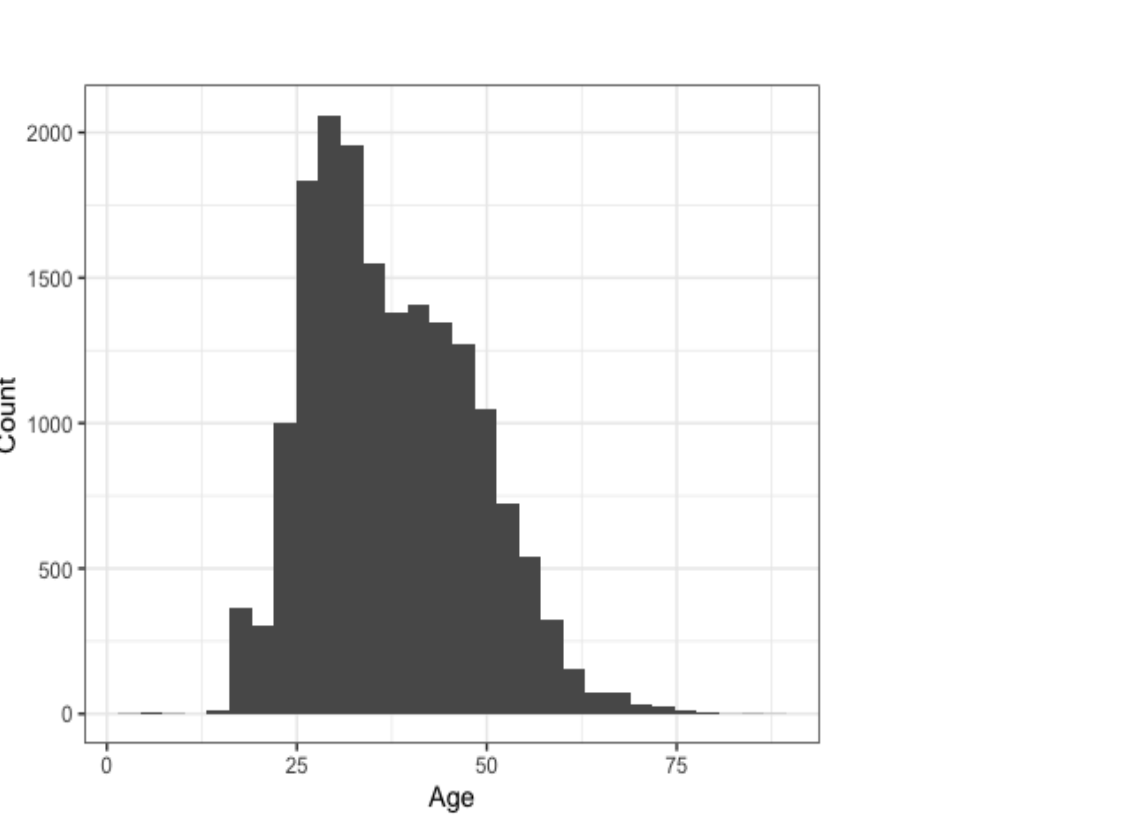 Create a histogram for variable Ageas shown below. Comment on the skewness of the distribution. (Hint: geom_histogram(): to draw histogram, theme_bw(): black and white theme, and labs(): change the labels of axes)
having trouble with the code to achieve this?
2000- 1500- Count 500 2000- 1500- Count 500
Step by Step Solution
There are 3 Steps involved in it
1 Expert Approved Answer
Step: 1 Unlock

Question Has Been Solved by an Expert!
Get step-by-step solutions from verified subject matter experts
Step: 2 Unlock
Step: 3 Unlock