

Question: Create a horizontal and vertical analysis from the above data 8/31/2019 45,400,000 23,485,000 9,444,000 8,384,000 1,050,000 1,535,000 1,535,000 11,395,000 11,395,000 1,111,000 21,915,000 20,890,000 32,626,000 8/31/2018
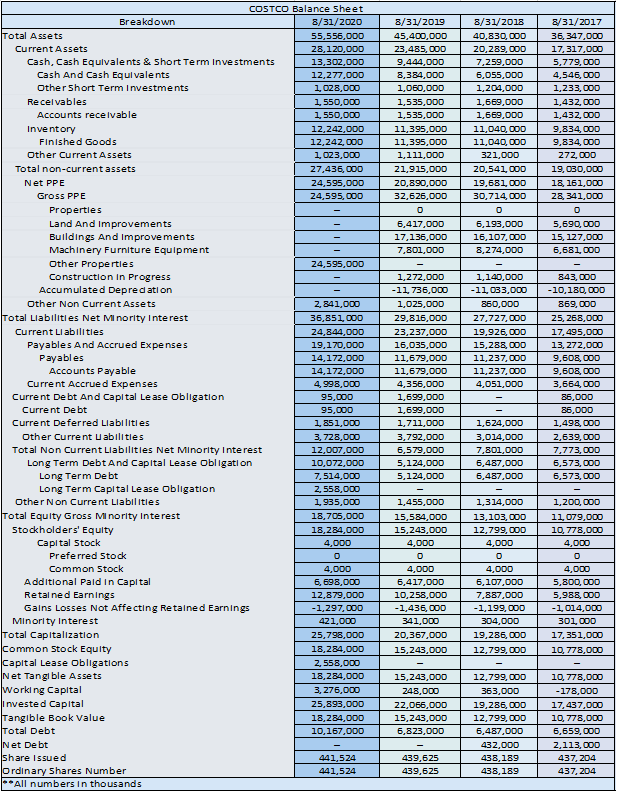
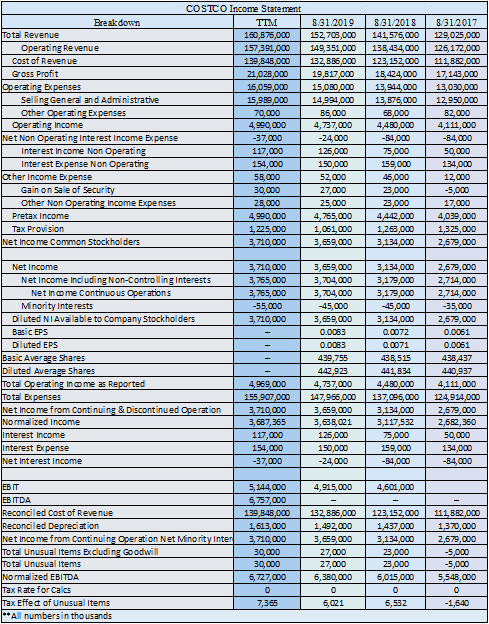
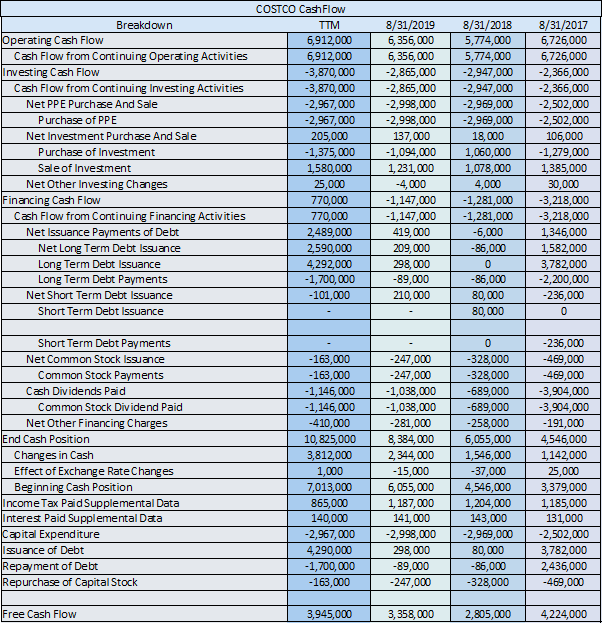
Create a horizontal and vertical analysis from the above data
8/31/2019 45,400,000 23,485,000 9,444,000 8,384,000 1,050,000 1,535,000 1,535,000 11,395,000 11,395,000 1,111,000 21,915,000 20,890,000 32,626,000 8/31/2018 40,830,000 20,289,000 7,259,000 6,055,000 1,204,000 1,669,000 1,669,000 11,040,000 11,040,000 321,000 20,541,000 19,681,000 30,714,000 8/31/2017 36,347,000 17,317,000 5,779,000 4,546,000 1,233,000 1,432,000 1,432,000 9,834,000 9,834,000 272,000 19,030,000 18, 161,000 28, 341,000 0 5,690,000 15, 127,000 6,681,000 6,417,000 17,136,000 7,801,000 6,193,000 16,107,000 8,274,000 COSTCO Balance Sheet Breakdown 8/31/2020 Total Assets 55,556,000 Current Assets 28,120,000 Cash, Cash Equivalents & Short Term Investments 13,302,000 Cash And Cash Equivalents 12,277,000 Other Short Term Investments 1 028,000 Recelvables 1,550,000 Accounts receivable 1,550,000 Inventory 12,242,000 Finished Goods 12,242,000 Other Current Assets 1,023,000 Total non-current assets 27,436,000 Net PPE 24,595,000 Gross PPE 24,595,000 Properties Land and improvements Buildings And Improvements Machinery Furniture Equipment Other Properties 24,595,000 Construction In Progress Accumulated Deprecation Other Non Current Assets 2,841,000 Total Liabilities Net Minority interest 36,851.000 Current Liabilities 24,844,000 Payables And Accrued Expenses 19,170.000 Payables 14,172,000 Accounts Payable 14,172,000 Current Accrued Expenses 4.998,000 Current Debt And Capital Lease Obligation 95,000 Current Debt 95,000 Current Deferred Liabilities 1,251,000 Other Current U abilities 3,728,000 Total Non Current Liabilities Net Minority Interest 12,007,000 Long Term Debt And Capital Lease Obligation 10,072.000 Long Term Debt 7,514,000 Long Term Capital Lease Obligation 2.558,000 Other Non Current Liabilities 1.935,000 Total Equity Gross Minority Interest 18,705,000 Stockholders' Equity 18,284,000 Capital Stock 4,000 Preferred Stock 0 Common Stock 4,000 Additional Paldin Capital 6,698,000 Retained Earnings 12,879,000 Gains Losses Not Affecting Retained Earnings -1,297,000 Minority Interest 421,000 Total Capitalization 25,798,000 Common Stock Equity 18,284,000 Capital Lease Obligations 2.558,000 Net Tangible Assets 18,284,000 Working Capital 3, 276,000 Invested Capital 25,893,000 Tangible Book Value 18,284,000 Total Debt 10,167,000 Net Debt Share Issued 441,524 Ordinary Shares Number 441,524 **All numbers in thousands 1,272,000 -11.736,000 1,025,000 29,816,000 23,237,000 16,035,000 11,679,000 11,679,000 4,356,000 1,699,000 1,699,000 1,711,000 3,792.000 6,579,000 5,124,000 5,124,000 1,140,000 -11,033,000 860,000 27,727,000 19,926,000 15,288,000 11,237,000 11,237,000 4,051,000 843,000 -10,180,000 869,000 25, 268,000 17,495,000 13, 272,000 9,608,000 9,608,000 3,664,000 86,000 86,000 1,498,000 2,639,000 7,773, 000 6,573,000 6,573,000 1,624,000 3,014,000 7,801,000 6,487,000 6,487,000 1,455,000 15,584,000 15,243,000 4,000 0 4,000 6,417,000 10,258,000 -1,436,000 341,000 20,367.000 15,243,000 1,314,000 13,103,000 12,799,000 4,000 0 4,000 6,107.000 7,887,000 -1,199,000 304,000 19,286,000 12,799,000 1,200,000 11,079,000 10, 778,000 4,000 0 4,000 5,800,000 5,988,000 -1,014,000 301.000 17,351,000 10,778,000 15,243,000 248,000 22,066,000 15,243,000 6,823,000 12,799,000 363,000 19,286,000 12,799,000 6,487,000 432,000 438,189 438,189 10, 778,000 -178,000 17,437,000 10,778,000 6,659,000 2,113,000 437,204 437, 204 439,625 439,625 Break down Total Revenue Operating Revenue Cost of Revenue Gross Profit Operating Expenses Selling General and Administrative Other Operating Expenses Operating Income Net Non Operating interest Income Expense Interest Income Non Operating Interest Expense Non Operating other income Expense Gain on sale of Security Other Non Operating Income Expenses Pretax Income Tax Provision Net Income Common Stockholders COSTCO Income Statement TTM 8.31.2019 160,675,000 152,703,000 157,391,000 149,351,000 139,848,000 132,885,000 21,028,000 19,817,000 15,059,000 15,000,000 15,989,000 14,994,000 70,000 85,000 4,990,000 4,737,000 -37,000 -24,000 117,000 125,000 154,000 150,000 58,000 52,000 30,000 27,000 28,000 25,000 4,990,000 4,765,000 1,225,000 1,061,000 3,710,000 3,659,000 8.51/2018 141,576,000 138,434,000 123, 152,000 18,424,000 13,944,000 13,676,000 68,000 4,480,000 -54,000 75,000 159,000 45,000 23,000 23,000 4,442,000 1,263,000 3,134,000 8/312017 129,025,000 126,172,000 111,882,000 17,143,000 13,030,000 12,950,000 62,000 4,111,000 -84,000 50,000 134,000 12,000 -5,000 17,000 4,039,000 1,325,000 2,679,000 3,710,000 3,765,000 3,755,000 -55,000 3,710,000 Net Income Net Income Including Non-Controlling Interests Net Income Continuous Operations Minority Interests Diluted NI Available to company Stockholders Basic EPS Diluted EPS Basic Average Shares Diluted Average Shares Total Operating inome as Reported Total Expenses Net Income from Continuing & Discontinued Operation Normalized Income Interest Income Interest Expense Net Interest Income 3,659,000 3,704,000 3,704,000 -45,000 3,659,000 0.0083 0.0083 439,755 442,923 4,737,000 147,966,000 3,659,000 3,638,021 125,000 150,000 -24,000 3,134,000 3,179,000 3,179,000 -45,000 3,134,000 0.0072 0.0071 438,515 441,834 4,480,000 137,096,000 3,134,000 3,117,532 75,000 159,000 -84,000 2,679,000 2,714,000 2,714,000 -35,000 2,679,000 0.0061 0.0061 438,437 440,937 4,111,000 124,914,000 2,579,000 2,662,360 50,000 134,000 -84,000 4,969,000 155,907,000 3,710,000 3,687,365 117,000 154,000 -37,000 4,915,000 4,501,000 EB IT EBITDA Reconciled Cost of Revenue Reconciled Depreciation Net Income from Continuing Operation Net Minority Inter Total Unusual Items Excluding Goodwill Total Unusual Items Normalized EBITDA Tax Rate for Cales Tax Effect of Unusual Items **All numbersin thousands 5,144,000 6,757,000 139,848,000 1,613,000 3,710,000 30,000 30,000 6,727,000 0 7,365 132,885,000 1,492,000 3,659,000 27,000 27,000 6,380,000 0 6,021 123,152,000 1,437,000 3,134,000 23,000 23,000 6,015,000 0 6,532 111,882,000 1,370,000 2,679,000 -5,000 -5,000 5,548,000 0 -1,640 Breakdown Operating Cash Flow Cash Flow from Continuing Operating Activities Investing Cash Flow Cash Flow from Continuing Investing Activities Net PPE Purchase And Sale Purchase of PPE Net Investment Purchase And Sale Purchase of Investment Sale of Investment Net Other Investing Changes Financing Cash Flow Cash Flow from Continuing Financing Activities Net Issuance Payments of Debt Net Long Term Debt Issuance Long Term Debt Issuance Long Term Debt Payments Net Short Term Debt Issuance Short Term Debt Issuance COSTCO Cash Flow TTM 6,912,000 6,912,000 -3,870,000 -3,870,000 -2,967,000 -2,967,000 205,000 -1,375,000 1,580,000 25,000 770,000 770,000 2,489,000 2,590,000 4,292,000 -1,700,000 -101,000 8/31/2019 6,356,000 6,356,000 -2,865,000 -2,865,000 -2,998,000 -2,998,000 137,000 -1,094,000 1,231,000 -4,000 -1,147,000 -1,147,000 419,000 209,000 298,000 -89,000 210,000 8/31/2018 5,774,000 5,774,000 -2,947,000 -2,947,000 -2,969,000 -2,969,000 18,000 1,060,000 1,078,000 4,000 -1,281,000 -1,281,000 -6,000 -86,000 0 -86,000 80,000 80,000 8/31/2017 6,726,000 6,726,000 -2,366,000 -2,366,000 -2,502,000 -2,502,000 106,000 -1,279,000 1,385,000 30,000 -3,218,000 -3,218,000 1,346,000 1,582,000 3,782,000 -2,200,000 -236,000 0 Short Term Debt Payments Net Common Stock Issuance Common Stock Payments Cash Dividends Paid Common Stock Dividend Paid Net Other Financing Charges End Cash Position Changes in Cash Effect of Exchange Rate Changes Beginning Cash Position Income Tax Paid Supplemental Data Interest Paid Supplemental Data Capital Expenditure ssuance of Debt Repayment of Debt Repurchase of Capital Stock -163,000 -163,000 -1,146,000 -1,146,000 - 410,000 10, 825,000 3,812,000 1,000 7,013,000 865,000 140,000 -2,967,000 4,290,000 -1,700,000 -163,000 -247,000 -247,000 -1,038,000 -1,038,000 -281,000 8,384,000 2,344,000 - 15,000 6,055,000 1,187,000 141,000 -2,998,000 298,000 -89,000 -247,000 0 -328,000 -328,000 -689,000 -689,000 -258,000 6,055,000 1,546,000 -37,000 4,546,000 1,204,000 143,000 -2,969,000 80,000 -86,000 -328,000 -236,000 -469,000 -469,000 -3,904,000 -3,904,000 -191,000 4,546,000 1,142,000 25,000 3,379,000 1,185,000 131,000 -2,502,000 3,782,000 2,436,000 -469,000 Free Cash Flow 3,945,000 3,358,000 2,805,000 4,224,000 8/31/2019 45,400,000 23,485,000 9,444,000 8,384,000 1,050,000 1,535,000 1,535,000 11,395,000 11,395,000 1,111,000 21,915,000 20,890,000 32,626,000 8/31/2018 40,830,000 20,289,000 7,259,000 6,055,000 1,204,000 1,669,000 1,669,000 11,040,000 11,040,000 321,000 20,541,000 19,681,000 30,714,000 8/31/2017 36,347,000 17,317,000 5,779,000 4,546,000 1,233,000 1,432,000 1,432,000 9,834,000 9,834,000 272,000 19,030,000 18, 161,000 28, 341,000 0 5,690,000 15, 127,000 6,681,000 6,417,000 17,136,000 7,801,000 6,193,000 16,107,000 8,274,000 COSTCO Balance Sheet Breakdown 8/31/2020 Total Assets 55,556,000 Current Assets 28,120,000 Cash, Cash Equivalents & Short Term Investments 13,302,000 Cash And Cash Equivalents 12,277,000 Other Short Term Investments 1 028,000 Recelvables 1,550,000 Accounts receivable 1,550,000 Inventory 12,242,000 Finished Goods 12,242,000 Other Current Assets 1,023,000 Total non-current assets 27,436,000 Net PPE 24,595,000 Gross PPE 24,595,000 Properties Land and improvements Buildings And Improvements Machinery Furniture Equipment Other Properties 24,595,000 Construction In Progress Accumulated Deprecation Other Non Current Assets 2,841,000 Total Liabilities Net Minority interest 36,851.000 Current Liabilities 24,844,000 Payables And Accrued Expenses 19,170.000 Payables 14,172,000 Accounts Payable 14,172,000 Current Accrued Expenses 4.998,000 Current Debt And Capital Lease Obligation 95,000 Current Debt 95,000 Current Deferred Liabilities 1,251,000 Other Current U abilities 3,728,000 Total Non Current Liabilities Net Minority Interest 12,007,000 Long Term Debt And Capital Lease Obligation 10,072.000 Long Term Debt 7,514,000 Long Term Capital Lease Obligation 2.558,000 Other Non Current Liabilities 1.935,000 Total Equity Gross Minority Interest 18,705,000 Stockholders' Equity 18,284,000 Capital Stock 4,000 Preferred Stock 0 Common Stock 4,000 Additional Paldin Capital 6,698,000 Retained Earnings 12,879,000 Gains Losses Not Affecting Retained Earnings -1,297,000 Minority Interest 421,000 Total Capitalization 25,798,000 Common Stock Equity 18,284,000 Capital Lease Obligations 2.558,000 Net Tangible Assets 18,284,000 Working Capital 3, 276,000 Invested Capital 25,893,000 Tangible Book Value 18,284,000 Total Debt 10,167,000 Net Debt Share Issued 441,524 Ordinary Shares Number 441,524 **All numbers in thousands 1,272,000 -11.736,000 1,025,000 29,816,000 23,237,000 16,035,000 11,679,000 11,679,000 4,356,000 1,699,000 1,699,000 1,711,000 3,792.000 6,579,000 5,124,000 5,124,000 1,140,000 -11,033,000 860,000 27,727,000 19,926,000 15,288,000 11,237,000 11,237,000 4,051,000 843,000 -10,180,000 869,000 25, 268,000 17,495,000 13, 272,000 9,608,000 9,608,000 3,664,000 86,000 86,000 1,498,000 2,639,000 7,773, 000 6,573,000 6,573,000 1,624,000 3,014,000 7,801,000 6,487,000 6,487,000 1,455,000 15,584,000 15,243,000 4,000 0 4,000 6,417,000 10,258,000 -1,436,000 341,000 20,367.000 15,243,000 1,314,000 13,103,000 12,799,000 4,000 0 4,000 6,107.000 7,887,000 -1,199,000 304,000 19,286,000 12,799,000 1,200,000 11,079,000 10, 778,000 4,000 0 4,000 5,800,000 5,988,000 -1,014,000 301.000 17,351,000 10,778,000 15,243,000 248,000 22,066,000 15,243,000 6,823,000 12,799,000 363,000 19,286,000 12,799,000 6,487,000 432,000 438,189 438,189 10, 778,000 -178,000 17,437,000 10,778,000 6,659,000 2,113,000 437,204 437, 204 439,625 439,625 Break down Total Revenue Operating Revenue Cost of Revenue Gross Profit Operating Expenses Selling General and Administrative Other Operating Expenses Operating Income Net Non Operating interest Income Expense Interest Income Non Operating Interest Expense Non Operating other income Expense Gain on sale of Security Other Non Operating Income Expenses Pretax Income Tax Provision Net Income Common Stockholders COSTCO Income Statement TTM 8.31.2019 160,675,000 152,703,000 157,391,000 149,351,000 139,848,000 132,885,000 21,028,000 19,817,000 15,059,000 15,000,000 15,989,000 14,994,000 70,000 85,000 4,990,000 4,737,000 -37,000 -24,000 117,000 125,000 154,000 150,000 58,000 52,000 30,000 27,000 28,000 25,000 4,990,000 4,765,000 1,225,000 1,061,000 3,710,000 3,659,000 8.51/2018 141,576,000 138,434,000 123, 152,000 18,424,000 13,944,000 13,676,000 68,000 4,480,000 -54,000 75,000 159,000 45,000 23,000 23,000 4,442,000 1,263,000 3,134,000 8/312017 129,025,000 126,172,000 111,882,000 17,143,000 13,030,000 12,950,000 62,000 4,111,000 -84,000 50,000 134,000 12,000 -5,000 17,000 4,039,000 1,325,000 2,679,000 3,710,000 3,765,000 3,755,000 -55,000 3,710,000 Net Income Net Income Including Non-Controlling Interests Net Income Continuous Operations Minority Interests Diluted NI Available to company Stockholders Basic EPS Diluted EPS Basic Average Shares Diluted Average Shares Total Operating inome as Reported Total Expenses Net Income from Continuing & Discontinued Operation Normalized Income Interest Income Interest Expense Net Interest Income 3,659,000 3,704,000 3,704,000 -45,000 3,659,000 0.0083 0.0083 439,755 442,923 4,737,000 147,966,000 3,659,000 3,638,021 125,000 150,000 -24,000 3,134,000 3,179,000 3,179,000 -45,000 3,134,000 0.0072 0.0071 438,515 441,834 4,480,000 137,096,000 3,134,000 3,117,532 75,000 159,000 -84,000 2,679,000 2,714,000 2,714,000 -35,000 2,679,000 0.0061 0.0061 438,437 440,937 4,111,000 124,914,000 2,579,000 2,662,360 50,000 134,000 -84,000 4,969,000 155,907,000 3,710,000 3,687,365 117,000 154,000 -37,000 4,915,000 4,501,000 EB IT EBITDA Reconciled Cost of Revenue Reconciled Depreciation Net Income from Continuing Operation Net Minority Inter Total Unusual Items Excluding Goodwill Total Unusual Items Normalized EBITDA Tax Rate for Cales Tax Effect of Unusual Items **All numbersin thousands 5,144,000 6,757,000 139,848,000 1,613,000 3,710,000 30,000 30,000 6,727,000 0 7,365 132,885,000 1,492,000 3,659,000 27,000 27,000 6,380,000 0 6,021 123,152,000 1,437,000 3,134,000 23,000 23,000 6,015,000 0 6,532 111,882,000 1,370,000 2,679,000 -5,000 -5,000 5,548,000 0 -1,640 Breakdown Operating Cash Flow Cash Flow from Continuing Operating Activities Investing Cash Flow Cash Flow from Continuing Investing Activities Net PPE Purchase And Sale Purchase of PPE Net Investment Purchase And Sale Purchase of Investment Sale of Investment Net Other Investing Changes Financing Cash Flow Cash Flow from Continuing Financing Activities Net Issuance Payments of Debt Net Long Term Debt Issuance Long Term Debt Issuance Long Term Debt Payments Net Short Term Debt Issuance Short Term Debt Issuance COSTCO Cash Flow TTM 6,912,000 6,912,000 -3,870,000 -3,870,000 -2,967,000 -2,967,000 205,000 -1,375,000 1,580,000 25,000 770,000 770,000 2,489,000 2,590,000 4,292,000 -1,700,000 -101,000 8/31/2019 6,356,000 6,356,000 -2,865,000 -2,865,000 -2,998,000 -2,998,000 137,000 -1,094,000 1,231,000 -4,000 -1,147,000 -1,147,000 419,000 209,000 298,000 -89,000 210,000 8/31/2018 5,774,000 5,774,000 -2,947,000 -2,947,000 -2,969,000 -2,969,000 18,000 1,060,000 1,078,000 4,000 -1,281,000 -1,281,000 -6,000 -86,000 0 -86,000 80,000 80,000 8/31/2017 6,726,000 6,726,000 -2,366,000 -2,366,000 -2,502,000 -2,502,000 106,000 -1,279,000 1,385,000 30,000 -3,218,000 -3,218,000 1,346,000 1,582,000 3,782,000 -2,200,000 -236,000 0 Short Term Debt Payments Net Common Stock Issuance Common Stock Payments Cash Dividends Paid Common Stock Dividend Paid Net Other Financing Charges End Cash Position Changes in Cash Effect of Exchange Rate Changes Beginning Cash Position Income Tax Paid Supplemental Data Interest Paid Supplemental Data Capital Expenditure ssuance of Debt Repayment of Debt Repurchase of Capital Stock -163,000 -163,000 -1,146,000 -1,146,000 - 410,000 10, 825,000 3,812,000 1,000 7,013,000 865,000 140,000 -2,967,000 4,290,000 -1,700,000 -163,000 -247,000 -247,000 -1,038,000 -1,038,000 -281,000 8,384,000 2,344,000 - 15,000 6,055,000 1,187,000 141,000 -2,998,000 298,000 -89,000 -247,000 0 -328,000 -328,000 -689,000 -689,000 -258,000 6,055,000 1,546,000 -37,000 4,546,000 1,204,000 143,000 -2,969,000 80,000 -86,000 -328,000 -236,000 -469,000 -469,000 -3,904,000 -3,904,000 -191,000 4,546,000 1,142,000 25,000 3,379,000 1,185,000 131,000 -2,502,000 3,782,000 2,436,000 -469,000 Free Cash Flow 3,945,000 3,358,000 2,805,000 4,224,000
Step by Step Solution
There are 3 Steps involved in it

Get step-by-step solutions from verified subject matter experts