

Question: Create a LINE plot in python using the following file and expectations. Use the following csv file Calculate the overall average grade for each student.
Create a LINE plot in python using the following file and expectations.
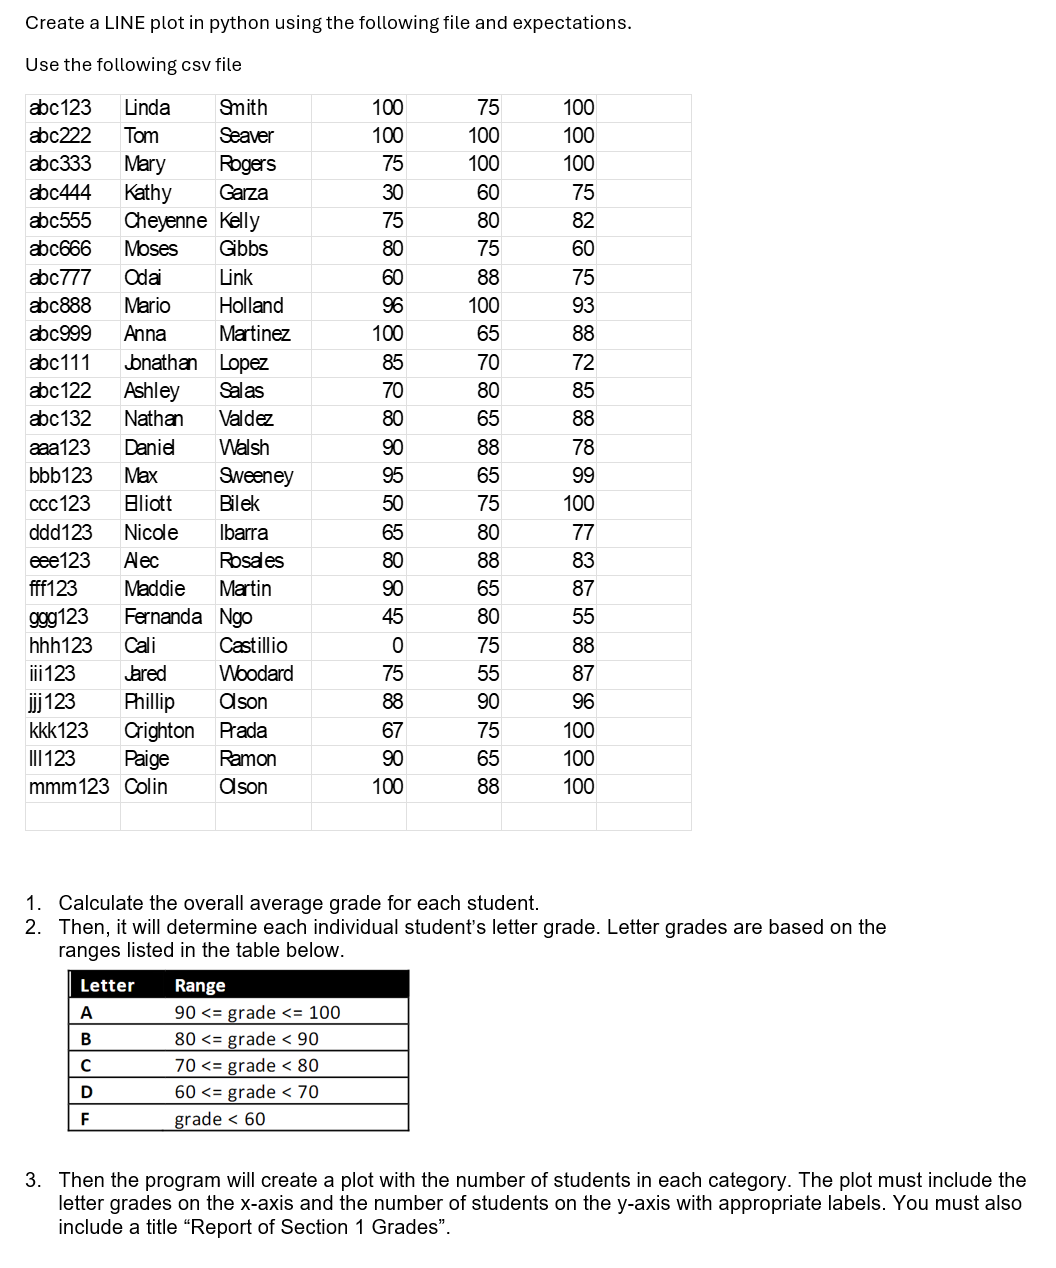
Use the following csv file
Calculate the overall average grade for each student.
Then, it will determine each individual student's letter grade. Letter grades are based on the
ranges listed in the table below.
Then the program will create a plot with the number of students in each category. The plot must include the
letter grades on the xaxis and the number of students on the yaxis with appropriate labels. You must also
include a title "Report of Section Grades".
Step by Step Solution
There are 3 Steps involved in it
1 Expert Approved Answer
Step: 1 Unlock

Question Has Been Solved by an Expert!
Get step-by-step solutions from verified subject matter experts
Step: 2 Unlock
Step: 3 Unlock