

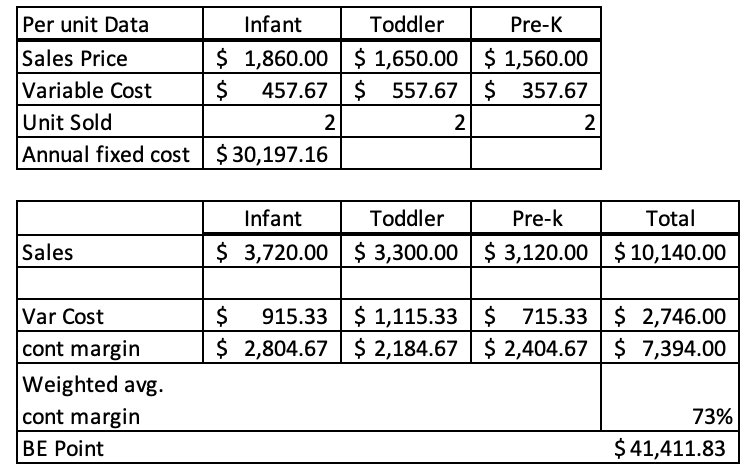
Question: Create a linear graphical representation that shows when this company will start making a profit and the break - even point.
Create a linear graphical representation that shows when this company will start making a profit and the breakeven point.
Step by Step Solution
There are 3 Steps involved in it
1 Expert Approved Answer
Step: 1 Unlock

Question Has Been Solved by an Expert!
Get step-by-step solutions from verified subject matter experts
Step: 2 Unlock
Step: 3 Unlock