

Question: create a locational break even cost and graph E The fixed and variable costs for three potential plant sites for a foundry are shown below.
create a locational break even cost and graph 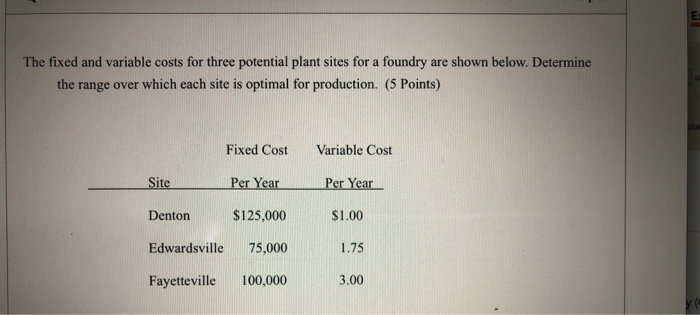
E The fixed and variable costs for three potential plant sites for a foundry are shown below. Determine the range over which each site is optimal for production. (5 Points) Fixed Cost Variable Cost Site Per Year Per Year Denton $125,000 $1.00 Edwardsville 75,000 1.75 Fayetteville 100,000 3.00 Step by Step Solution
There are 3 Steps involved in it
1 Expert Approved Answer
Step: 1 Unlock

Question Has Been Solved by an Expert!
Get step-by-step solutions from verified subject matter experts
Step: 2 Unlock
Step: 3 Unlock