

Question: - Create a main MATLAB script that performs the tasks described below. - Between each task, place a comment indicating the task your code is
- Create a main MATLAB script that performs the tasks described below.
- Between each task, place a comment indicating the task your code is performing next.
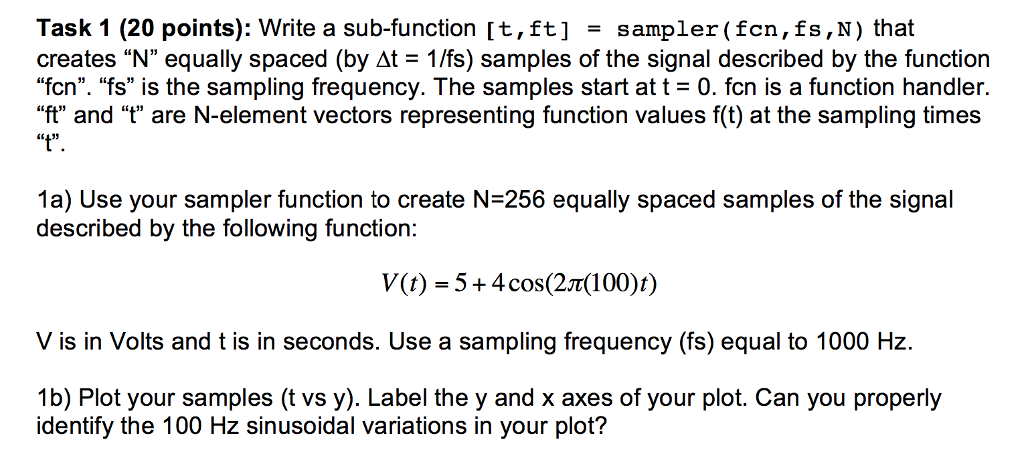
Task 1 (20 points): Write a sub-function (t, ft] = sampler (fcn, fs, N) that creates N equally spaced (by At = 1/fs) samples of the signal described by the function "fcn. fs" is the sampling frequency. The samples start at t = 0. fcn is a function handler. ft" and "" are N-element vectors representing function values f(t) at the sampling times "4". 1a) Use your sampler function to create N=256 equally spaced samples of the signal described by the following function: V(t) = 5 + 4 cos(27(100)t) V is in Volts and t is in seconds. Use a sampling frequency (fs) equal to 1000 Hz. 1b) Plot your samples (t vs y). Label the y and x axes of your plot. Can you properly identify the 100 Hz sinusoidal variations in your plot
Step by Step Solution
There are 3 Steps involved in it

Get step-by-step solutions from verified subject matter experts