

Question: Create a Matlab function for the following question. Use a for loop to create a figure that contains six subplots, each showing one of the
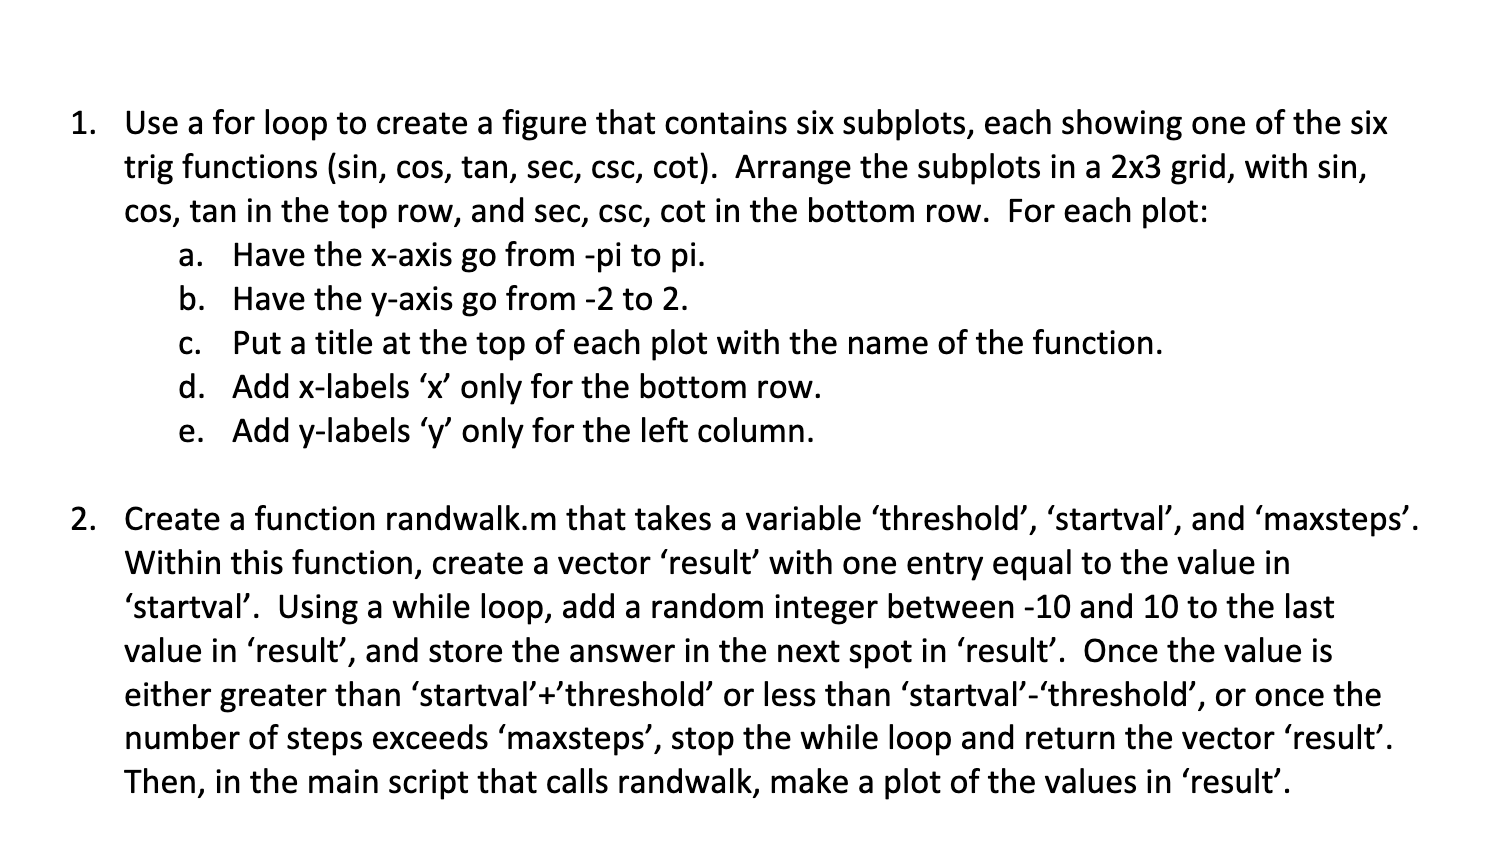
Create a Matlab function for the following question. Use a for loop to create a figure that contains six subplots, each showing one of the six
trig functions Arrange the subplots in a grid, with sin
cos tan in the top row, and sec csc cot in the bottom row. For each plot:
a Have the xaxis go from pi to pi
b Have the axis go from to
c Put a title at the top of each plot with the name of the function.
d Add labels only for the bottom row.
e Add labels only for the left column.
Create a function randwalk.m that takes a variable 'threshold', 'startval', and 'maxsteps'.
Within this function, create a vector 'result' with one entry equal to the value in
'startval'. Using a while loop, add a random integer between and to the last
value in 'result', and store the answer in the next spot in 'result'. Once the value is
either greater than 'startval''threshold' or less than 'startval''threshold', or once the
number of steps exceeds 'maxsteps', stop the while loop and return the vector 'result'.
Then, in the main script that calls randwalk, make a plot of the values in 'result'.
Step by Step Solution
There are 3 Steps involved in it
1 Expert Approved Answer
Step: 1 Unlock

Question Has Been Solved by an Expert!
Get step-by-step solutions from verified subject matter experts
Step: 2 Unlock
Step: 3 Unlock