

Question: : Create a Matlab script that generates and plots three trigonometric functions, namely, a sine wave, a cosine wave, and a tangent wave, over
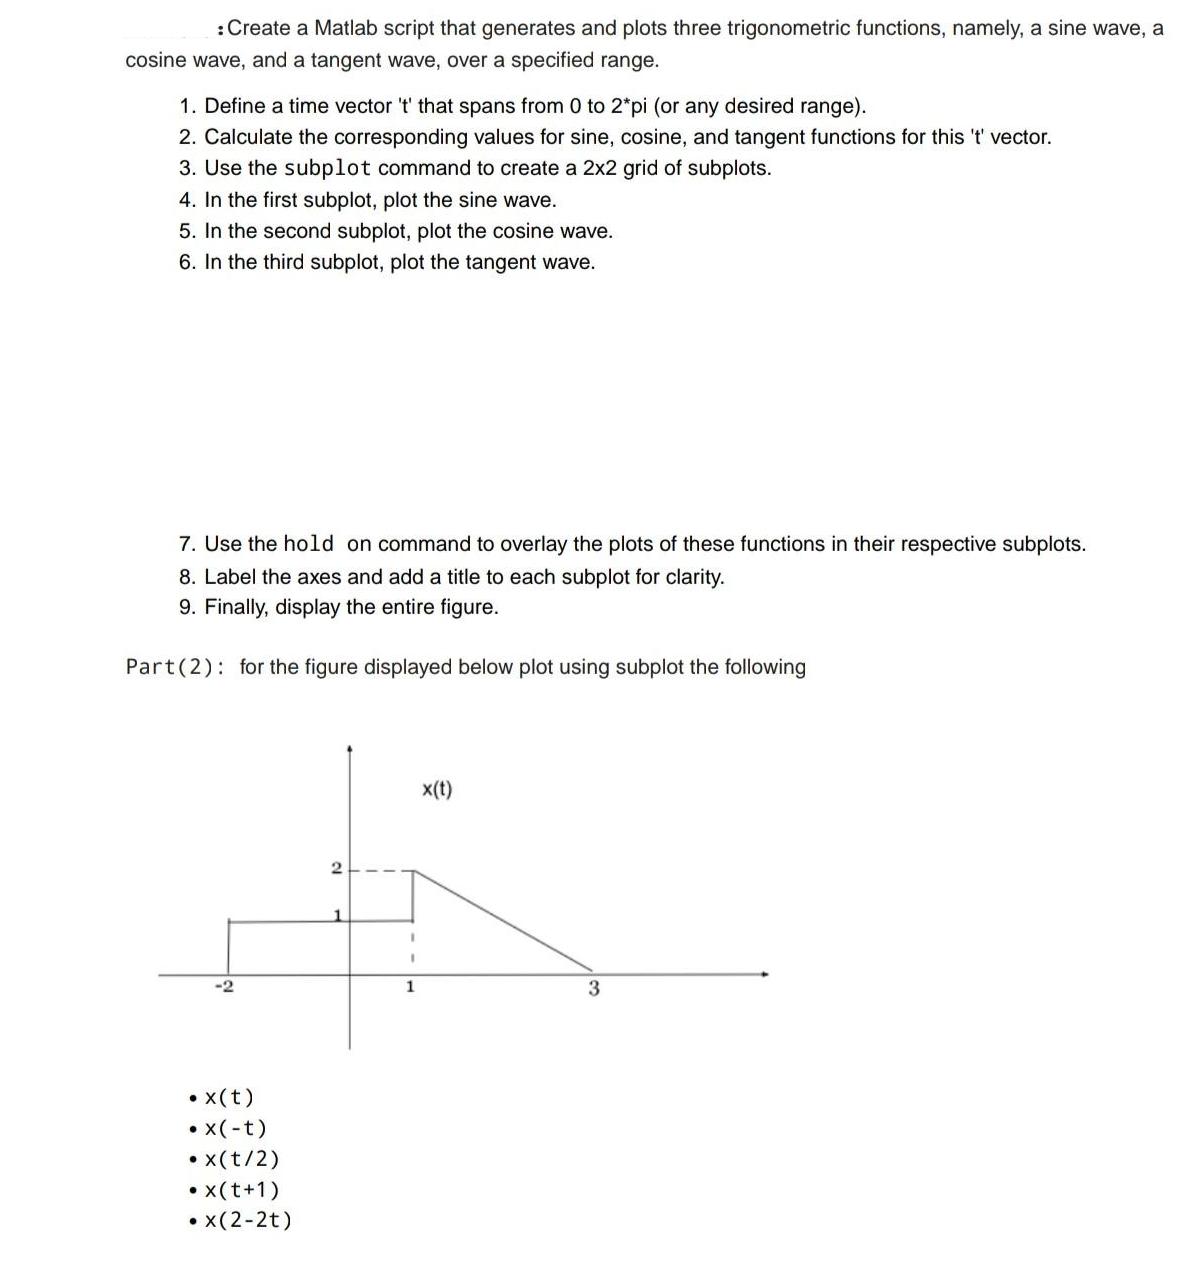
: Create a Matlab script that generates and plots three trigonometric functions, namely, a sine wave, a cosine wave, and a tangent wave, over a specified range. 1. Define a time vector 't' that spans from 0 to 2*pi (or any desired range). 2. Calculate the corresponding values for sine, cosine, and tangent functions for this 't' vector. 3. Use the subplot command to create a 2x2 grid of subplots. 4. In the first subplot, plot the sine wave. 5. In the second subplot, plot the cosine wave. 6. In the third subplot, plot the tangent wave. 7. Use the hold on command to overlay the plots of these functions in their respective subplots. 8. Label the axes and add a title to each subplot for clarity. 9. Finally, display the entire figure. Part (2) for the figure displayed below plot using subplot the following -2 X(t) x(-t) x(t/2) x(t+1) x(2-2t) 2 1 1 x(t) 3
Step by Step Solution
There are 3 Steps involved in it
Steps Step 1 of 2 The code required to plot the given function is given below t00012pi x1sint x2cost ... View full answer

Get step-by-step solutions from verified subject matter experts