

Question: Create a minimum of five visuals in Excel to show how the Laurentian University is performing against the other given Universities. In particular, compare all
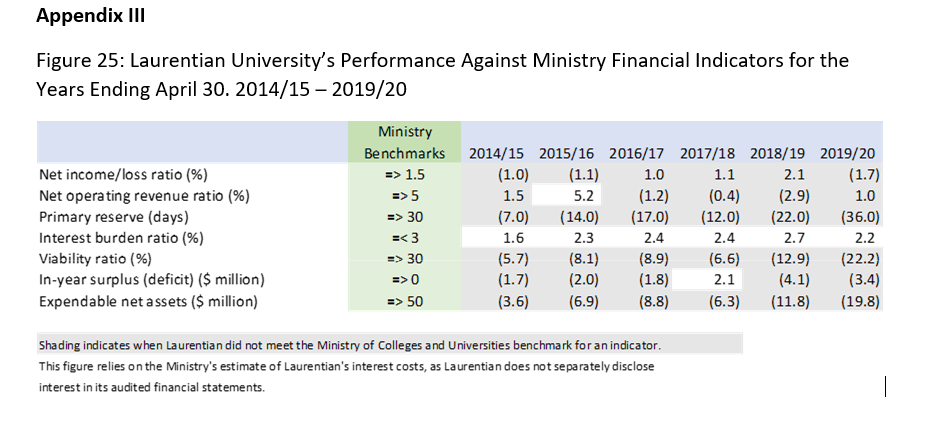
Create a minimum of five visuals in Excel to show how the Laurentian University is performing against the other given Universities. In particular, compare all of the financial indicators shown in Appendix III, attached across the universities and Laurentian University. The case also provides you additional information faculty salaries, student counts etc. that you are welcome to use should you believe that the information is important and applicable to your determination of whether or not Laurentian University might be in financial distress.
Appendix III Benchmarks Defined:
Net incomeloss ratio Net IncomeTotal revenue
Net operating revenue ratio Cash flow from operationsTotal revenue
Primary reserve daysExpendable net assetsTotal expenses X days
Interest burden ratio Interest expenseTotal expenses amortization
Viability ratio Expendable net assetsLongterm debt
In year surplus as a percent of revenue Total revenues Total expenses
Expendable net assets Net assets investments in capital assets future employee benefits asset future employee benefits liability endowment fund
Step by Step Solution
There are 3 Steps involved in it
1 Expert Approved Answer
Step: 1 Unlock

Question Has Been Solved by an Expert!
Get step-by-step solutions from verified subject matter experts
Step: 2 Unlock
Step: 3 Unlock