

Question: Create a minimum of three functions which analyze, and plot various metrics related to Covid-19 over time. The functions could be: 1. State cases per
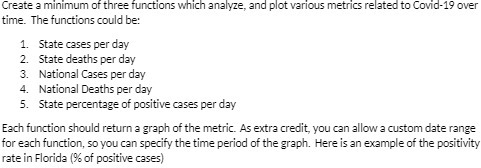
Create a minimum of three functions which analyze, and plot various metrics related to Covid-19 over time. The functions could be: 1. State cases per day 2. State deaths per day 3. National Cases per day 4. National Deaths per day 5. State percentage of positive cases per day Each function should return a graph of the metric. As extra credit, you can allow a custom date range for each function, so you can specify the time period of the graph. Here is an example of the positivity rate in Florida (% of positive cases)
Step by Step Solution
There are 3 Steps involved in it
1 Expert Approved Answer
Step: 1 Unlock

Question Has Been Solved by an Expert!
Get step-by-step solutions from verified subject matter experts
Step: 2 Unlock
Step: 3 Unlock