

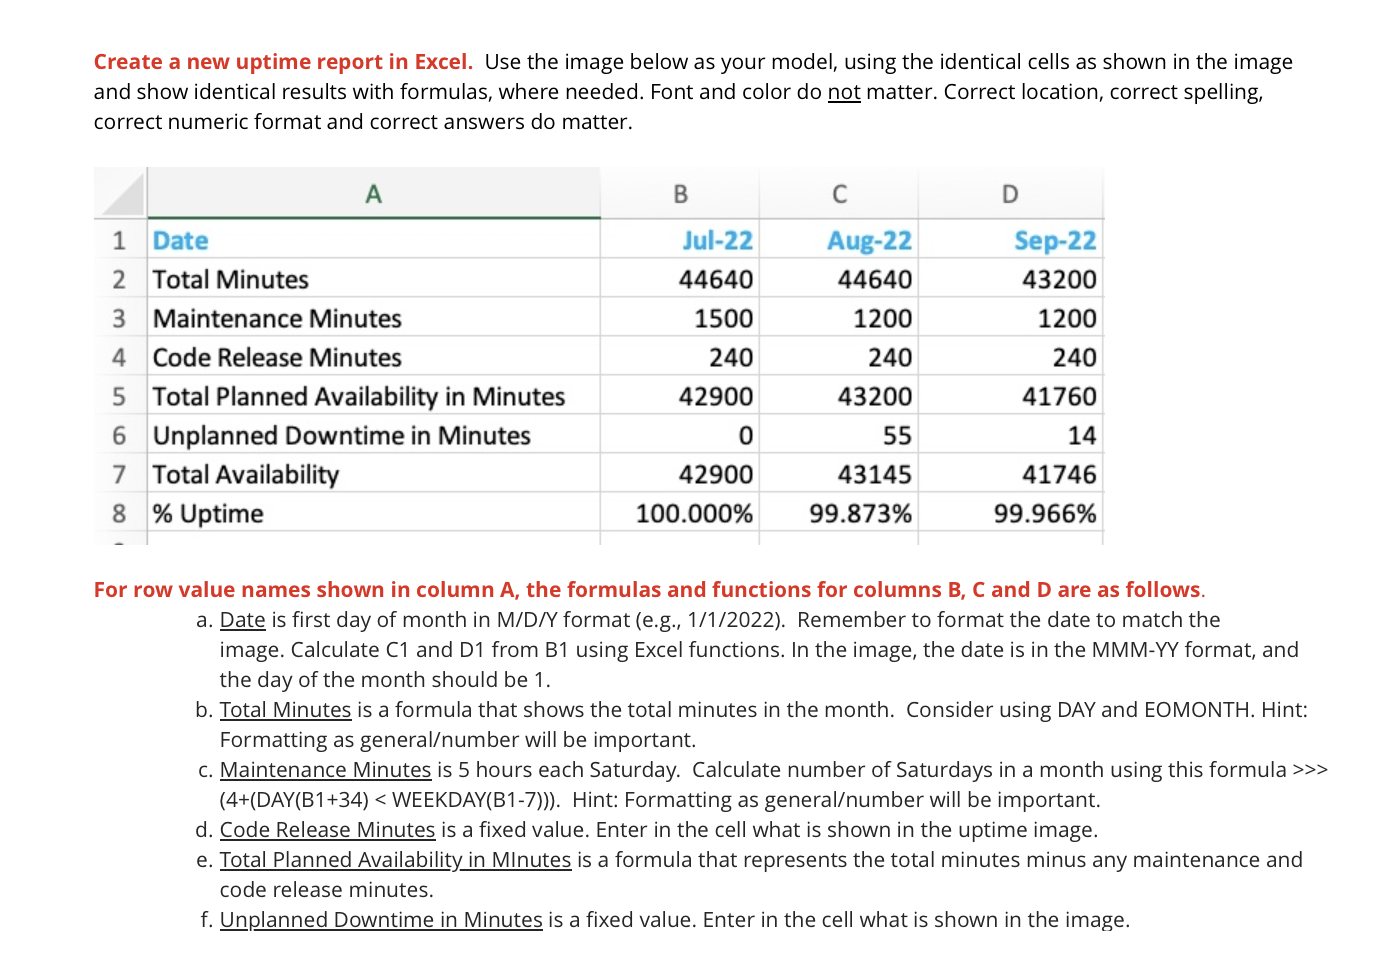
Question: Create a new uptime report in Excel. Use the image below as your model, using the identical cells as shown in the image and show
Create a new uptime report in Excel. Use the image below as your model, using the identical cells as shown in the image
and show identical results with formulas, where needed. Font and color do not matter. Correct location, correct spelling,
correct numeric format and correct answers do matter.
For row value names shown in column the formulas and functions for columns and are as follows.
a Date is first day of month in MDY format eg Remember to format the date to match the
image. Calculate C and D from B using Excel functions. In the image, the date is in the MMMYY format, and
the day of the month should be
b Total Minutes is a formula that shows the total minutes in the month. Consider using DAY and EOMONTH. Hint:
Formatting as generalnumber will be important.
c Maintenance Minutes is hours each Saturday. Calculate number of Saturdays in a month using this formula
DAYB WEEKDAYB Hint: Formatting as generalnumber will be important.
d Code Release Minutes is a fixed value. Enter in the cell what is shown in the uptime image.
e Total Planned Availability in MInutes is a formula that represents the total minutes minus any maintenance and
code release minutes.
f Unplanned Downtime in Minutes is a fixed value. Enter in the cell what is shown in the image.
what are the formulas that should be inputted in my excel sheet for question ce and f
Step by Step Solution
There are 3 Steps involved in it
1 Expert Approved Answer
Step: 1 Unlock

Question Has Been Solved by an Expert!
Get step-by-step solutions from verified subject matter experts
Step: 2 Unlock
Step: 3 Unlock