

Question: create a pareto chart Using the Pareto method, what are the two top complaint categories that would make up at least half (50%) of the
create a pareto chart
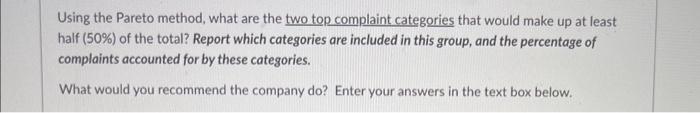
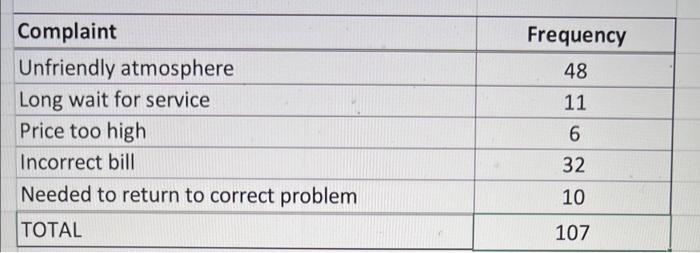
Using the Pareto method, what are the two top complaint categories that would make up at least half (50%) of the total? Report which categories are included in this group, and the percentage of complaints accounted for by these categories. What would you recommend the company do? Enter your answers in the text box below. \begin{tabular}{|l|c|} \hline Complaint & Frequency \\ \hline Unfriendly atmosphere & 48 \\ \hline Long wait for service & 11 \\ \hline Price too high & 6 \\ \hline Incorrect bill & 32 \\ \hline Needed to return to correct problem & 10 \\ \hline TOTAL & 107 \\ \hline \end{tabular}
Step by Step Solution
There are 3 Steps involved in it
1 Expert Approved Answer
Step: 1 Unlock

Question Has Been Solved by an Expert!
Get step-by-step solutions from verified subject matter experts
Step: 2 Unlock
Step: 3 Unlock