

Question: Create a Pivot Chart that will show the trend in sales for each region. Hint: You will have to make another Pivot Table ( hidden
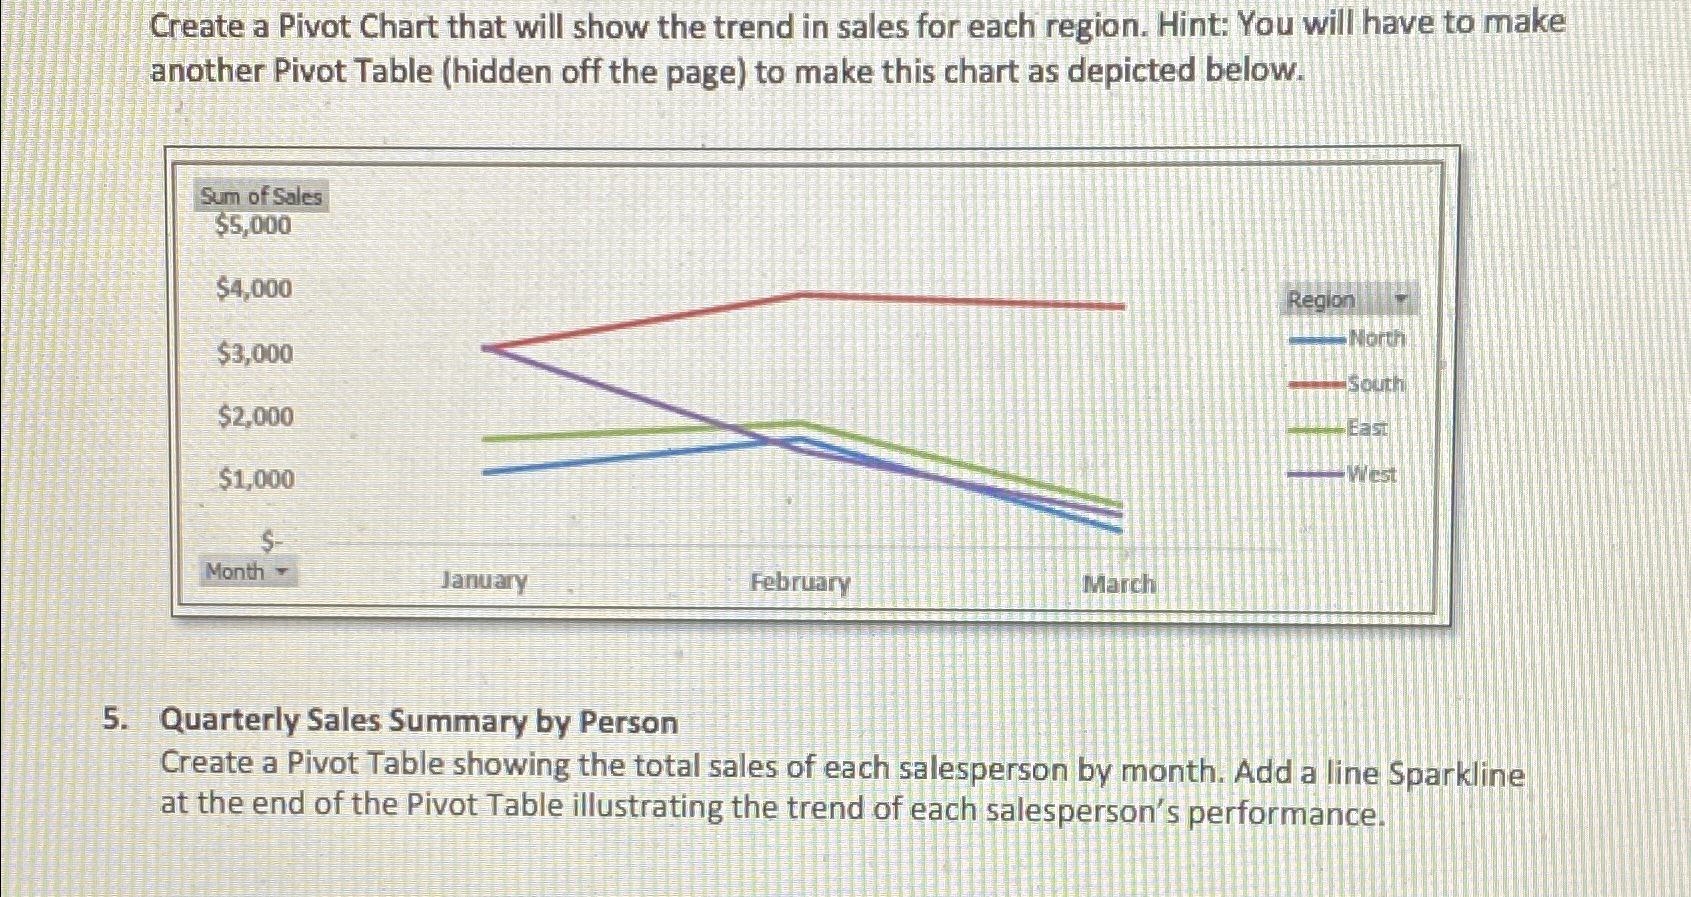
Create a Pivot Chart that will show the trend in sales for each region. Hint: You will have to make another Pivot Table hidden off the page to make this chart as depicted below.
Quarterly Sales Summary by Person
Create a Pivot Table showing the total sales of each salesperson by month. Add a line Sparkline at the end of the Pivot Table illustrating the trend of each salesperson's performance.
Step by Step Solution
There are 3 Steps involved in it
1 Expert Approved Answer
Step: 1 Unlock

Question Has Been Solved by an Expert!
Get step-by-step solutions from verified subject matter experts
Step: 2 Unlock
Step: 3 Unlock