

Question: Create a pivot table to summarize the total assets, total liabilities, and total stockholders equity over the 10-year period 2012-2021 (Hint: Need to calculate total
Create a pivot table to summarize the total assets, total liabilities, and total stockholders equity over the 10-year period 2012-2021 (Hint: Need to calculate total liabilities and total stockholders equity for each year) on a separate worksheet. Add calculated field to calculate the debt to equity ratio for the company (carried two decimal places) over the 10-year period 2012-2021. Label the worksheet DebtToEquity.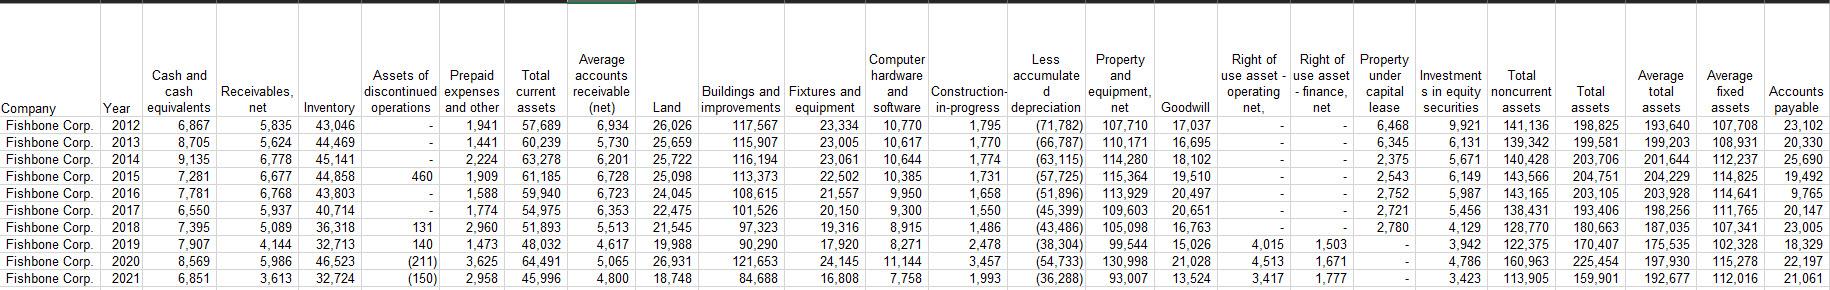
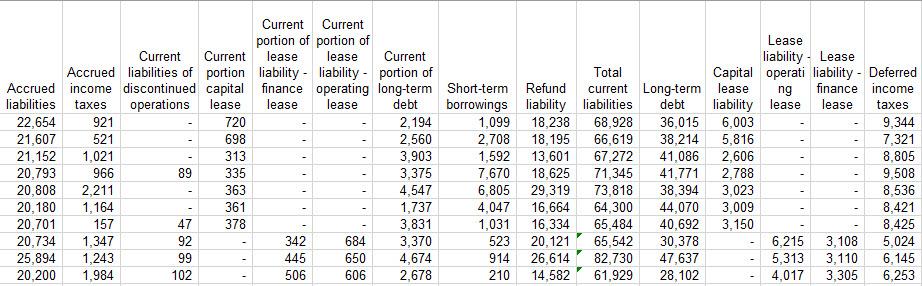
Cash and cash Company Year equivalents Fishbone Corp. 2012 6,867 Fishbone Corp. 2013 8,705 Fishbone Corp. 2014 9,135 Fishbone Corp. 2015 7.281 Fishbone Corp. 2016 7,781 Fishbone Corp. 2017 6,550 Fishbone Corp 2018 7,395 Fishbone Corp. 2019 7.907 Fishbone Corp. 2020 8,569 Fishbone Corp. 2021 6,851 Receivables, net 5,835 5.624 6,778 6,677 6,768 5.937 5.089 4,144 5.986 3,613 Average Assets of Prepaid Total accounts discontinued expenses current receivable Inventory operations and other assets (net) 43.046 1,941 57.689 6,934 44.469 1.441 60.239 5,730 45. 141 2.224 63,278 6.201 44,858 460 1,909 61,185 6.728 43,803 1.588 59,940 6,723 40.714 1,774 54.975 6,353 36,318 131 2.960 51,893 5,513 32,713 140 1,473 48,032 4.617 46.523 (211) 3,625 64.491 5,065 32,724 (150) 2,958 45,996 4.800 Land 26.026 25.659 25.722 25.098 24,045 22.475 21.545 19.988 26,931 18,748 Computer Less Property hardware accumulate and Buildings and Fixtures and and Construction- d equipment, improvements equipment software in-progress depreciation net 117,567 23,334 10.770 1,795 (71,782) 107,710 115.907 23,005 10,617 1.770 (66,787) 110,171 116.194 23,061 10.644 1,774 (63,115) 114,280 113,373 22,502 10,385 1,731 (57,725) 115,364 108,615 21,557 9,950 1,658 (51,896) 113,929 101,526 20.150 9,300 1,550 (45,399) 109,603 97,323 19,316 8,915 1,486 (43,486) 105,098 90.290 17.920 8.271 2.478 (38,304) 99.544 121,653 24.145 11.144 3,457 (54,733) 130,998 84.688 16,808 7,758 1,993 (36,288) 93,007 Goodwill 17,037 16,695 18,102 19,510 20,497 20,651 16,763 15.026 21,028 13,524 Right of Right of Property use asset - use asset under Investment Total operating - finance, capital sin equity noncurrent net net lease securities assets 6,468 9,921 141,136 6,345 6,131 139,342 2,375 5.671 140,428 2,543 6.149 143,566 2,752 5,987 143,165 2,721 5.456 138,431 2.780 4.129 128,770 4,015 1,503 3,942 122.375 4,513 1,671 4.786 160.963 3,417 1,777 3,423 113,905 Total assets 198,825 199,581 203,706 204,751 203,105 193.406 180,663 170,407 225.454 159,901 Average total assets 193,640 199,203 201,644 204,229 203.928 198,256 187,035 175.535 197,930 192,677 Average fixed assets 107,708 108,931 112,237 114,825 114,641 111,765 107,341 102.328 115,278 112,016 Accounts payable 23,102 20,330 25,690 19,492 9,765 20.147 23,005 18,329 22,197 21,061 Current Current portion of portion of Lease Current Current lease lease Current liability - Lease Accrued liabilities of portion liability - liability - portion of Total Capital operati liability - Deferred Accrued income discontinued capital finance operating long-term Short-term Refund current Long-term lease ng finance income liabilities taxes operations lease lease lease debt borrowings liability liabilities debt liability lease lease taxes 22,654 921 720 2,194 1,099 18,238 68,928 36,015 6,003 9,344 21,607 521 698 2,560 2,708 18,195 66,619 38,214 5,816 7,321 21,152 1,021 313 3,903 1,592 13,601 67,272 41,086 2,606 8,805 20,793 966 89 335 3,375 7,670 18,625 71,345 41.771 2,788 9,508 20,808 2,211 363 4,547 6,805 29,319 73,818 38,394 3,023 8,536 20,180 1,164 361 1,737 4,047 16,664 64,300 44,070 3,009 8,421 20,701 157 47 378 3,831 1,031 16,334 65,484 40,692 3,150 8,425 20,734 1,347 92 342 684 3,370 523 20,121 65,542 30,378 6,215 3,108 5,024 25,894 1,243 99 650 4,674 914 26,614 82,730 47,637 5,313 3,110 6,145 20,200 1.984 102 506 606 2,678 210 14,582 61,929 28,102 4,017 3,305 6,253 . 445 Cash and cash Company Year equivalents Fishbone Corp. 2012 6,867 Fishbone Corp. 2013 8,705 Fishbone Corp. 2014 9,135 Fishbone Corp. 2015 7.281 Fishbone Corp. 2016 7,781 Fishbone Corp. 2017 6,550 Fishbone Corp 2018 7,395 Fishbone Corp. 2019 7.907 Fishbone Corp. 2020 8,569 Fishbone Corp. 2021 6,851 Receivables, net 5,835 5.624 6,778 6,677 6,768 5.937 5.089 4,144 5.986 3,613 Average Assets of Prepaid Total accounts discontinued expenses current receivable Inventory operations and other assets (net) 43.046 1,941 57.689 6,934 44.469 1.441 60.239 5,730 45. 141 2.224 63,278 6.201 44,858 460 1,909 61,185 6.728 43,803 1.588 59,940 6,723 40.714 1,774 54.975 6,353 36,318 131 2.960 51,893 5,513 32,713 140 1,473 48,032 4.617 46.523 (211) 3,625 64.491 5,065 32,724 (150) 2,958 45,996 4.800 Land 26.026 25.659 25.722 25.098 24,045 22.475 21.545 19.988 26,931 18,748 Computer Less Property hardware accumulate and Buildings and Fixtures and and Construction- d equipment, improvements equipment software in-progress depreciation net 117,567 23,334 10.770 1,795 (71,782) 107,710 115.907 23,005 10,617 1.770 (66,787) 110,171 116.194 23,061 10.644 1,774 (63,115) 114,280 113,373 22,502 10,385 1,731 (57,725) 115,364 108,615 21,557 9,950 1,658 (51,896) 113,929 101,526 20.150 9,300 1,550 (45,399) 109,603 97,323 19,316 8,915 1,486 (43,486) 105,098 90.290 17.920 8.271 2.478 (38,304) 99.544 121,653 24.145 11.144 3,457 (54,733) 130,998 84.688 16,808 7,758 1,993 (36,288) 93,007 Goodwill 17,037 16,695 18,102 19,510 20,497 20,651 16,763 15.026 21,028 13,524 Right of Right of Property use asset - use asset under Investment Total operating - finance, capital sin equity noncurrent net net lease securities assets 6,468 9,921 141,136 6,345 6,131 139,342 2,375 5.671 140,428 2,543 6.149 143,566 2,752 5,987 143,165 2,721 5.456 138,431 2.780 4.129 128,770 4,015 1,503 3,942 122.375 4,513 1,671 4.786 160.963 3,417 1,777 3,423 113,905 Total assets 198,825 199,581 203,706 204,751 203,105 193.406 180,663 170,407 225.454 159,901 Average total assets 193,640 199,203 201,644 204,229 203.928 198,256 187,035 175.535 197,930 192,677 Average fixed assets 107,708 108,931 112,237 114,825 114,641 111,765 107,341 102.328 115,278 112,016 Accounts payable 23,102 20,330 25,690 19,492 9,765 20.147 23,005 18,329 22,197 21,061 Current Current portion of portion of Lease Current Current lease lease Current liability - Lease Accrued liabilities of portion liability - liability - portion of Total Capital operati liability - Deferred Accrued income discontinued capital finance operating long-term Short-term Refund current Long-term lease ng finance income liabilities taxes operations lease lease lease debt borrowings liability liabilities debt liability lease lease taxes 22,654 921 720 2,194 1,099 18,238 68,928 36,015 6,003 9,344 21,607 521 698 2,560 2,708 18,195 66,619 38,214 5,816 7,321 21,152 1,021 313 3,903 1,592 13,601 67,272 41,086 2,606 8,805 20,793 966 89 335 3,375 7,670 18,625 71,345 41.771 2,788 9,508 20,808 2,211 363 4,547 6,805 29,319 73,818 38,394 3,023 8,536 20,180 1,164 361 1,737 4,047 16,664 64,300 44,070 3,009 8,421 20,701 157 47 378 3,831 1,031 16,334 65,484 40,692 3,150 8,425 20,734 1,347 92 342 684 3,370 523 20,121 65,542 30,378 6,215 3,108 5,024 25,894 1,243 99 650 4,674 914 26,614 82,730 47,637 5,313 3,110 6,145 20,200 1.984 102 506 606 2,678 210 14,582 61,929 28,102 4,017 3,305 6,253 . 445
Step by Step Solution
There are 3 Steps involved in it

Get step-by-step solutions from verified subject matter experts