

Question: Create a plot ( Logistic Regression Plot ) of Vote versus Phys , then add a line showing the estimated probability curve. R Language Data
Create a plot (Logistic Regression Plot) of Vote versus Phys, then add a line showing the estimated probability curve.
R Language
Data set as following: Hospital.csv
| State | Phys | Beds | MedChg | Medicare | SocSec | SocChg | SupSec | SocEnr | Vote |
| AL | 233 | 339 | 9.6 | 16481.06 | 19824.64 | 9.42 | 3595.54 | 903569 | McCain |
| AK | 240 | 217 | 24.2 | 7862.3 | 9770.5 | 19.35 | 1667.12 | 64843 | McCain |
| AZ | 244 | 195 | 16.4 | 13235.25 | 15539.43 | 15.96 | 1648.92 | 922932 | McCain |
| AR | 226 | 348 | 7.1 | 16924.72 | 20373.79 | 8.14 | 3273.23 | 566219 | McCain |
| CA | 295 | 201 | 8.2 | 11683.97 | 12354.3 | 6.06 | 3348.38 | 4463873 | Obama |
| CO | 292 | 201 | 11.2 | 11139.94 | 12530.2 | 9.43 | 1190.35 | 584556 | Obama |
| CT | 401 | 224 | 2.3 | 15014.63 | 16670.93 | 1.25 | 1488.76 | 585199 | Obama |
| DE | 280 | 236 | 13.1 | 15030.87 | 17794.51 | 13.4 | 1632.08 | 150101 | Obama |
| FL | 293 | 287 | 8.5 | 17107.28 | 19281.79 | 7.34 | 2378.93 | 3430205 | Obama |
| GA | 243 | 277 | 12.3 | 11336.38 | 13593.03 | 12.01 | 2243.63 | 1233238 | McCain |
| HI | 351 | 250 | 10.2 | 14283.55 | 15742.15 | 9.22 | 1784.36 | 200743 | Obama |
| ID | 193 | 246 | 15.4 | 13329.69 | 15831.69 | 15.61 | 1557.7 | 226250 | McCain |
| IL | 298 | 274 | 3.7 | 13278.78 | 14831.94 | 2.87 | 2026.38 | 1893055 | Obama |
| IN | 236 | 302 | 6.1 | 14415.05 | 16962.03 | 6.48 | 1572.3 | 1063854 | Obama |
| IA | 213 | 371 | 2.7 | 16500.7 | 18618.74 | 2.03 | 1462.18 | 552294 | Obama |
| KS | 251 | 379 | 2.8 | 14618.9 | 16472.52 | 2.63 | 1426.83 | 452119 | McCain |
| KY | 253 | 369 | 8.6 | 16213.33 | 19112.93 | 7.85 | 4311.95 | 797660 | McCain |
| LA | 288 | 382 | 6.3 | 14130.8 | 15808.7 | 0.49 | 3375.56 | 715127 | McCain |
| ME | 308 | 270 | 8.7 | 17807.27 | 20484.67 | 7.97 | 2420.72 | 270706 | Obama |
| MD | 451 | 207 | 7.9 | 12434.94 | 13773.28 | 6.46 | 1690.17 | 771357 | Obama |
| MA | 487 | 253 | 1.4 | 15227.63 | 16674.56 | 0.6 | 2674.54 | 1066962 | Obama |
| MI | 267 | 257 | 5.9 | 14677.3 | 17277.86 | 6.18 | 2194.01 | 1748668 | Obama |
| MN | 313 | 316 | 6.6 | 13593.91 | 15340.11 | 6.43 | 1421.12 | 787377 | Obama |
| MS | 202 | 453 | 8.9 | 15600.32 | 18807.24 | 6.82 | 4264.99 | 549376 | McCain |
| MO | 261 | 332 | 5.8 | 15699.82 | 18329.61 | 5.43 | 2030.24 | 1063174 | McCain |
| MT | 262 | 468 | 8 | 15778.43 | 18102 | 7.58 | 1581.01 | 169375 | McCain |
| NE | 267 | 420 | 3 | 14858.31 | 16601.21 | 2.25 | 1269.68 | 291980 | McCain |
| NV | 211 | 204 | 23.7 | 12284.17 | 14342.55 | 20.69 | 1386.4 | 346345 | Obama |
| NH | 299 | 216 | 12.2 | 14564.25 | 16855.43 | 10.52 | 1045.01 | 220796 | Obama |
| NJ | 337 | 253 | 2.5 | 14141 | 15781.23 | 1.99 | 1745.16 | 1375796 | Obama |
| NM | 272 | 193 | 13.4 | 13784.75 | 16151.76 | 12.34 | 2793.27 | 311468 | Obama |
| NY | 424 | 333 | 3 | 14522.29 | 15902.91 | 1.83 | 3289.98 | 3062046 | Obama |
| NC | 282 | 275 | 11.8 | 14598.61 | 17386.21 | 11.74 | 2295.65 | 1509687 | Obama |
| ND | 270 | 561 | 0.6 | 16300.42 | 18017.3 | 0.07 | 1241.92 | 114712 | McCain |
| OH | 289 | 292 | 3.1 | 15303.62 | 17105.19 | 2.56 | 2183.91 | 1960946 | Obama |
| OK | 194 | 307 | 6.2 | 15205.15 | 17915.44 | 6.98 | 2247.62 | 635619 | McCain |
| OR | 305 | 181 | 9.7 | 14748.25 | 16990.24 | 10 | 1667.13 | 618624 | Obama |
| PA | 329 | 323 | 1.8 | 17164.13 | 19461.62 | 2.67 | 2556.86 | 2419005 | Obama |
| RI | 383 | 222 | 0.9 | 16084.54 | 17917.76 | 0.08 | 2802.85 | 192829 | Obama |
| SC | 256 | 267 | 13.6 | 15154.89 | 18295.3 | 13.06 | 2480.63 | 778480 | McCain |
| SD | 247 | 598 | 4.3 | 16056.8 | 18142.42 | 3.34 | 1616.38 | 140773 | McCain |
| TN | 286 | 346 | 10.4 | 15354.94 | 18273.63 | 9.95 | 2705.4 | 1089649 | McCain |
| TX | 232 | 259 | 11.4 | 11034.87 | 12914.41 | 12.06 | 2205.09 | 2952230 | McCain |
| UT | 233 | 187 | 14.1 | 9517.35 | 11056.31 | 13.26 | 915.38 | 273045 | McCain |
| VT | 417 | 237 | 8.2 | 15464.57 | 18016.37 | 7.44 | 2104.16 | 112251 | Obama |
| VA | 302 | 232 | 11.1 | 13111.6 | 15061.16 | 9.98 | 1819.13 | 1139748 | Obama |
| WA | 304 | 177 | 11.3 | 13016.58 | 14910.42 | 11.03 | 1839.96 | 937531 | Obama |
| WV | 255 | 409 | 5.2 | 19564.9 | 22789.53 | 5.2 | 4228.18 | 414053 | McCain |
| WI | 284 | 265 | 5.5 | 14917.74 | 17224.46 | 5.75 | 1666.99 | 953581 | Obama |
| WY | 216 | 405 | 8.5 | 13941.85 | 16001.56 | 7.07 | 1136.08 | 81495 | McCain |
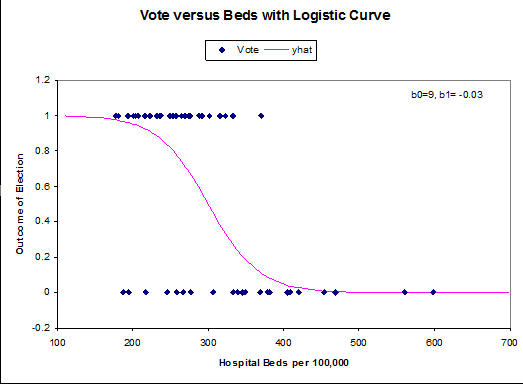
A plot similar to this. But this plot is using Vote versus Beds, and was plotted using Excel.
I need Vote versus Phys(which is the number of Physicians in the state per 100,000 residents) using R.
Vote versus Beds with Logistic Curve Vate yhat 1.2 b0-9, b1=-0.03 0.8 E 0.4 0.2 -0.2 100 200 300 400 500 Hospital Beds per 100,000
Step by Step Solution
There are 3 Steps involved in it
1 Expert Approved Answer
Step: 1 Unlock

Question Has Been Solved by an Expert!
Get step-by-step solutions from verified subject matter experts
Step: 2 Unlock
Step: 3 Unlock