

Question: Create a plot of a linear relationship between the type of diet ( categorical variable: low cholesterol vs . low saturated fat ) and the
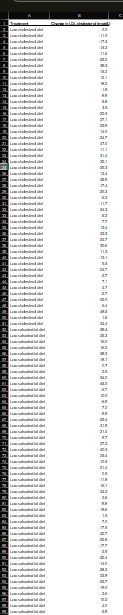
Create a plot of a linear relationship between the type of diet categorical variable: low cholesterol vs low saturated fat and the change in the concentration of LDL cholesterol continuous variable: mg dL This plot should follow the formatting guidelines listed below. Your plot should be formatted as an image file, PDF or xlsxlsx Click Choose a file and upload your linear relationship.
Formatting Instructions
General
Label your yaxes and xaxes clearly and include units in parentheses; Font size
Make sure the viewer can distinguish between the two treatments when looking at the figure.
Yaxis and Xaxis numbers: Font size
Make sure the minimum and maximum bounds for your axes are reasonable.
Provide tick marks for your axes where possible and appropriate.
Marker If your figure has markers
Make sure that your markers are clearly visible
Error bars If your data enables you to estimate the standard deviation
Direction: Both
End style: Cap
Error amount: Custom Select the appropriate cell in Excel.
Line: Solid line
Color: Black
Width: p
Step by Step Solution
There are 3 Steps involved in it
1 Expert Approved Answer
Step: 1 Unlock

Question Has Been Solved by an Expert!
Get step-by-step solutions from verified subject matter experts
Step: 2 Unlock
Step: 3 Unlock