

Question: Create a plotting program using pylab called lab 2 _ cards.py to show the distribution of two - card hands. It should include these functions:
Create a plotting program using pylab called labcards.py to show the distribution of twocard hands. It should include these functions:
Defines function graphtwocardsnumtrialsProduces a graph of twocard hand frequencies with some statistical annotations.
Defines function calcstatsdata Calculates mean and standard deviation from a dictionary of observation counts.
Defines function dealtwodeck Shuffles the deck, deals two cards, and returns the sum of their rank values.
Calls graphtwocards
Plot must also include:
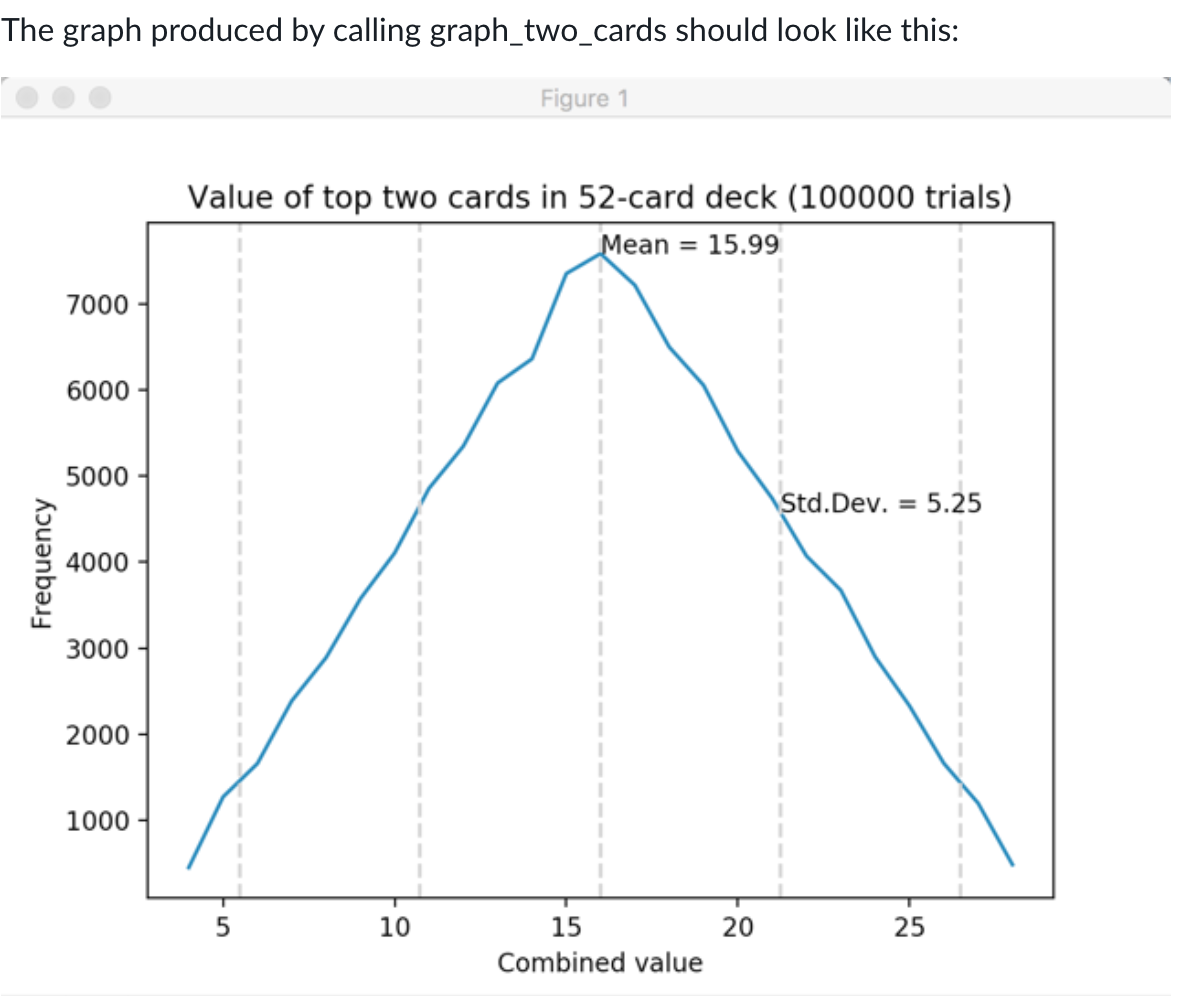
title must include the actual number of trials performed
labels and annotations as shown annotations for mean and must be at the right spots
gray dashed vertical bars for mean and and standard deviations
End result should look similar to the attached picture. The graph produced by calling graphtwocards should look like this:
Figure
Step by Step Solution
There are 3 Steps involved in it
1 Expert Approved Answer
Step: 1 Unlock

Question Has Been Solved by an Expert!
Get step-by-step solutions from verified subject matter experts
Step: 2 Unlock
Step: 3 Unlock