

Question: Create a pro forma for the property with the data below Market Financials Showing financials for this Market (Miami Number of Months Covered Statement Ending
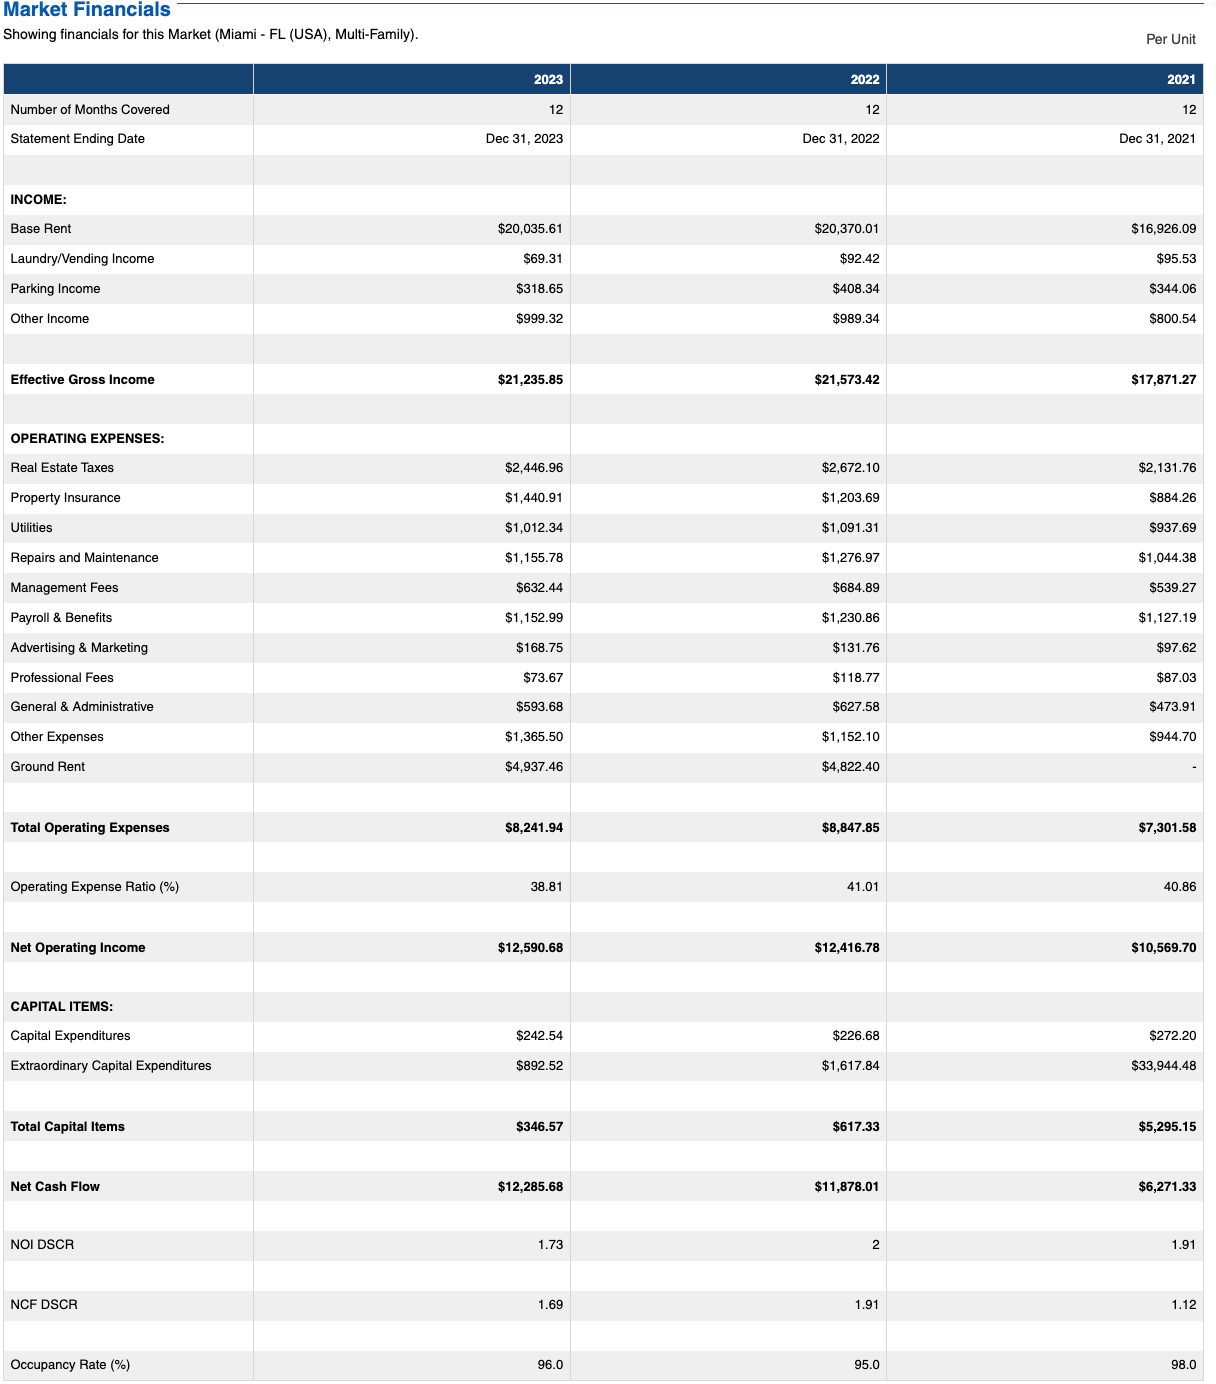
Market Financials Showing financials for this Market (Miami Number of Months Covered Statement Ending Date INCOME: Base Rent Laundry/Vending Income Parking Income Other Income Effective Gross Income OPERATING EXPENSES: Real Estate Taxes Property Insurance Utilities Repairs and Maintenance Management Fees Payroll & Benefits Advertising & Marketing Professional Fees General & Administrative Other Expenses Ground Rent Total Operating Expenses Operating Expense Ratio (%) Net Income CAPITAL ITEMS: Capital Expenditures Extraordinary Capital Expenditures Total Capital Items Net Cash Flow NOI DSCR NCF DSCR Occupancy Rate (%) - FL (USA), Multi-Family). 2023 12 Dec 31 , 2023 $20,035.61 $69.31 $318.65 $999.32 $21,235.85 $2,446.96 $1,440.91 $1,012.34 $1,155.78 $632.44 $1,152.99 $168.75 $73.67 $593.68 $1,365.50 $4,937.46 $8,241.94 38.81 $12,590.68 $242.54 $892.52 $346.57 $12,285.68 1.73 1.69 96.0 12 Dec 31, 2022 $20,370.01 $92.42 $408.34 $989.34 $21,573.42 $2,672.10 $1 ,203.69 $1,091.31 $1 ,276.97 $684.89 $1 ,230.86 $131.76 $118.77 $627.58 $1,152.10 $4,822.40 $8,847.85 41.01 $12,416.78 $226.68 $1 ,617.84 $617.33 $11,878.01 2 1.91 95.0 Per Unit 2021 12 Dec 31, 2021 $16,926.09 $95.53 $344.06 $800.54 $17,871.27 $2,131.76 $884.26 $937.69 $1 ,044.38 $539.27 $1,127.19 $97.62 $87.03 $473.91 $944.70 $7,301.58 40.86 $1m569.70 $272.20 $33,944.48 $5,295.15 $6,271.33 1.91 1.12 98.0
Step by Step Solution
There are 3 Steps involved in it

Get step-by-step solutions from verified subject matter experts