

Question: Create a Python program called expenses.py that uses matplotlib to plot a pie chart showing how much money (use percentages) is spent on the
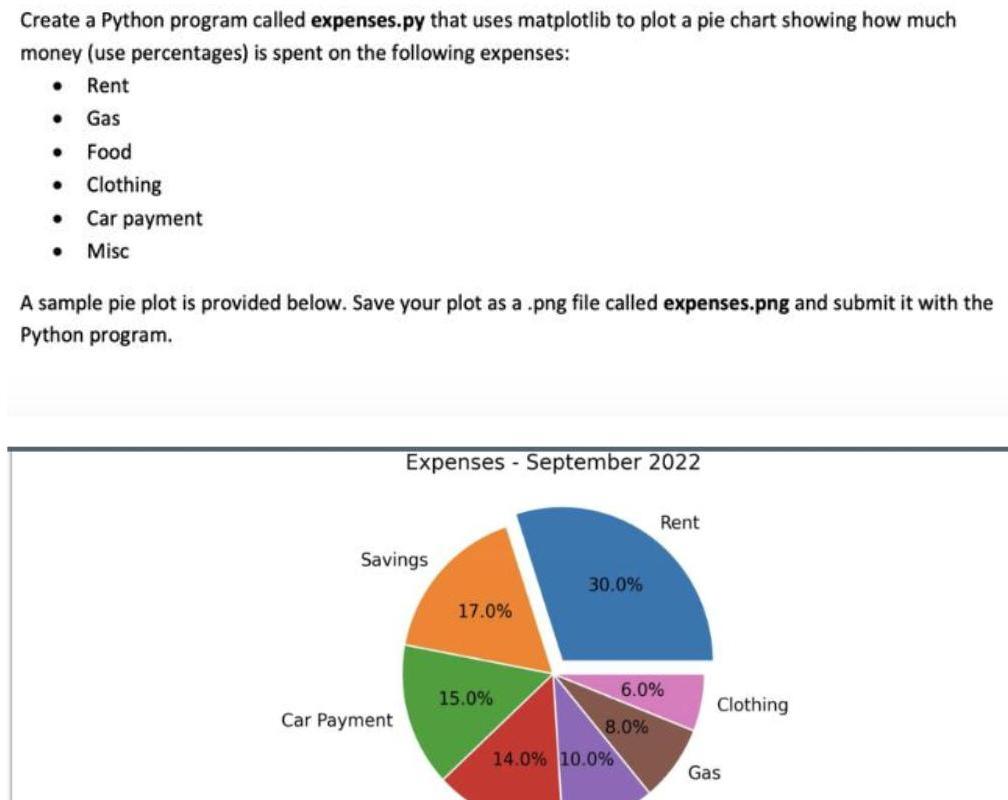
Create a Python program called expenses.py that uses matplotlib to plot a pie chart showing how much money (use percentages) is spent on the following expenses: Rent Gas Food Clothing . Car payment Misc A sample pie plot is provided below. Save your plot as a .png file called expenses.png and submit it with the Python program. Expenses - September 2022 Savings 30.0% 17.0% 15.0% Car Payment Rent 6.0% Clothing 8.0% 14.0% 10.0% Gas
Step by Step Solution
There are 3 Steps involved in it
1 Expert Approved Answer
Step: 1 Unlock

Question Has Been Solved by an Expert!
Get step-by-step solutions from verified subject matter experts
Step: 2 Unlock
Step: 3 Unlock