

Question: Create a Q-SWOT spreadsheet template for Amazon company on Excel. Q-SWOT The study of Business Analysis and Decision Making requires one to be thoughtful and
Create a Q-SWOT spreadsheet template for Amazon company on Excel. 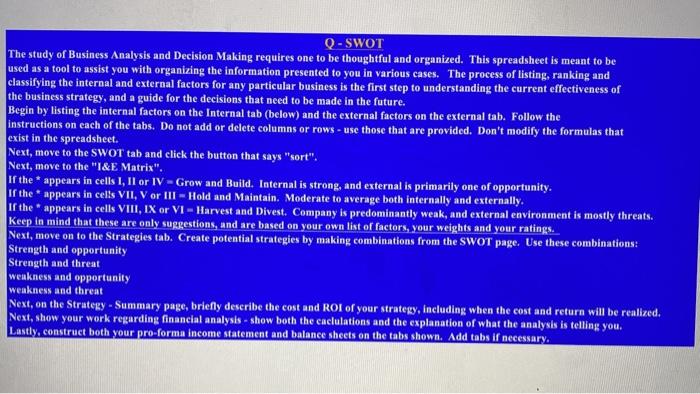
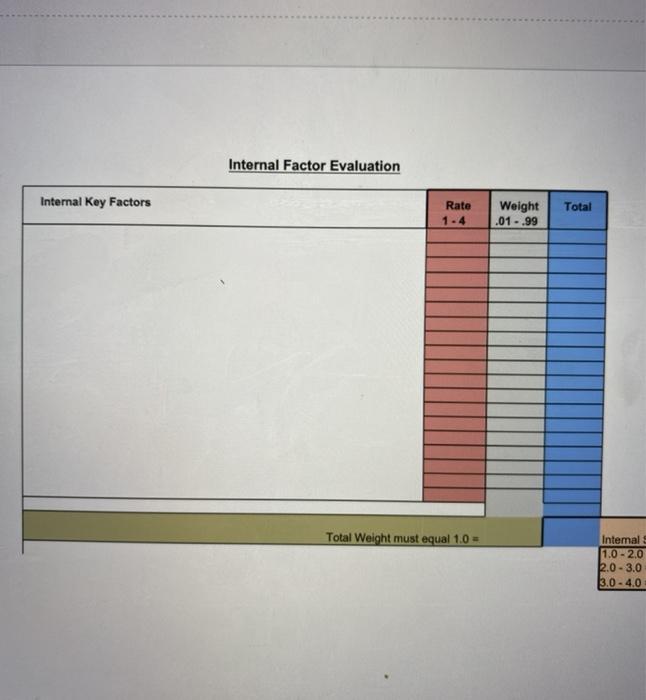
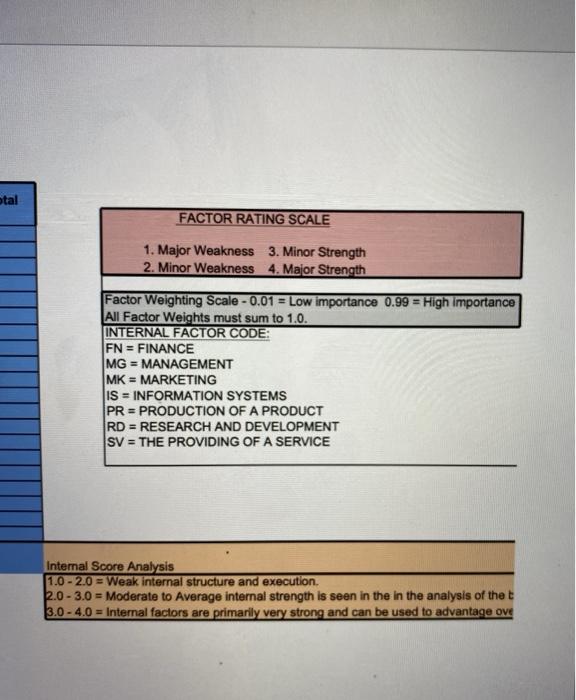
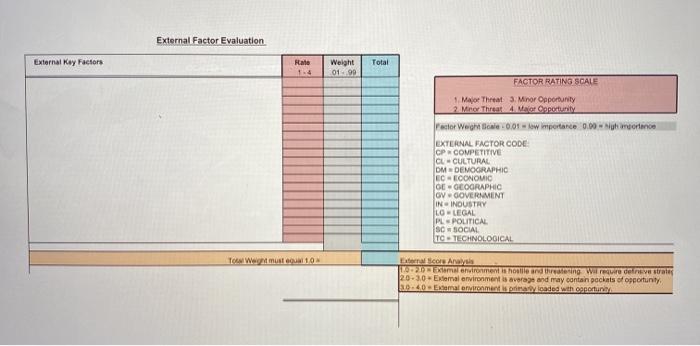
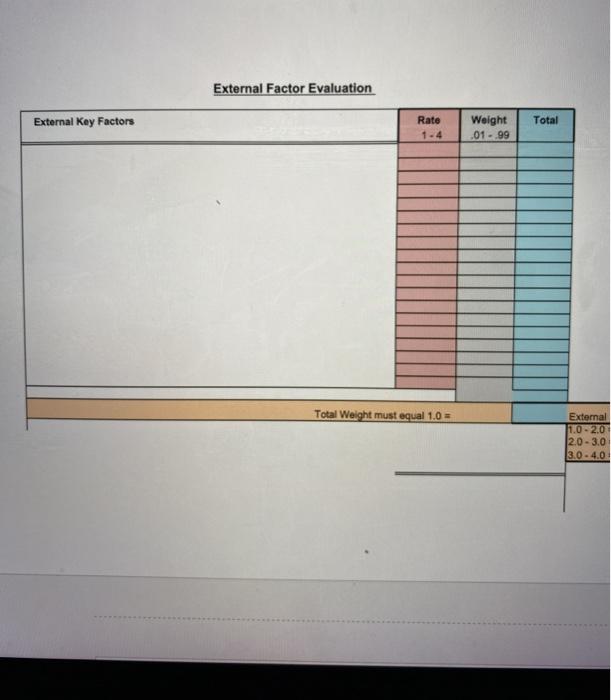
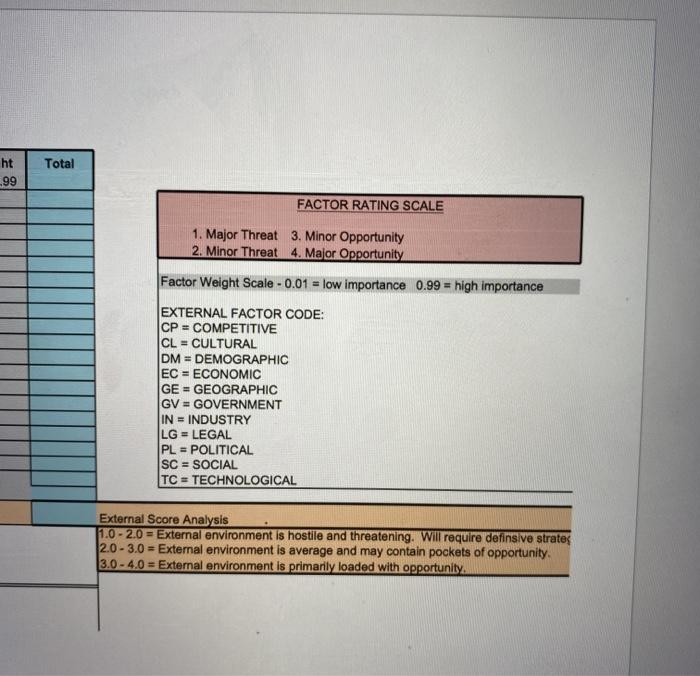
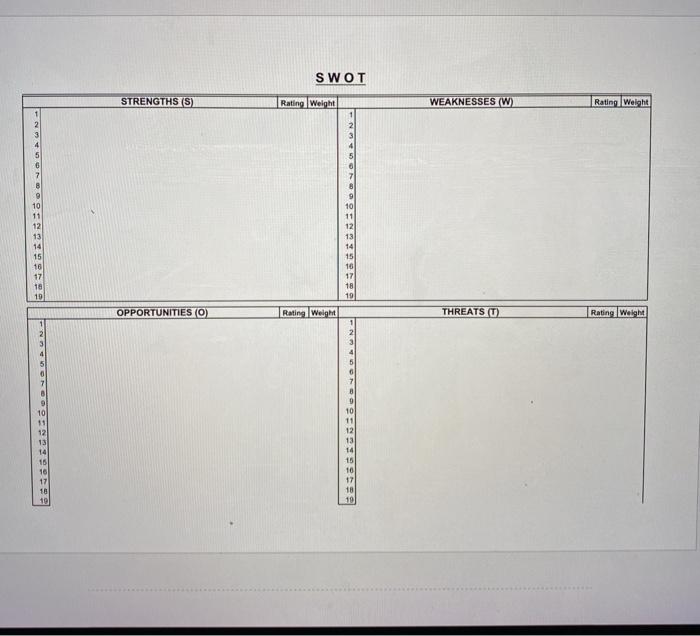
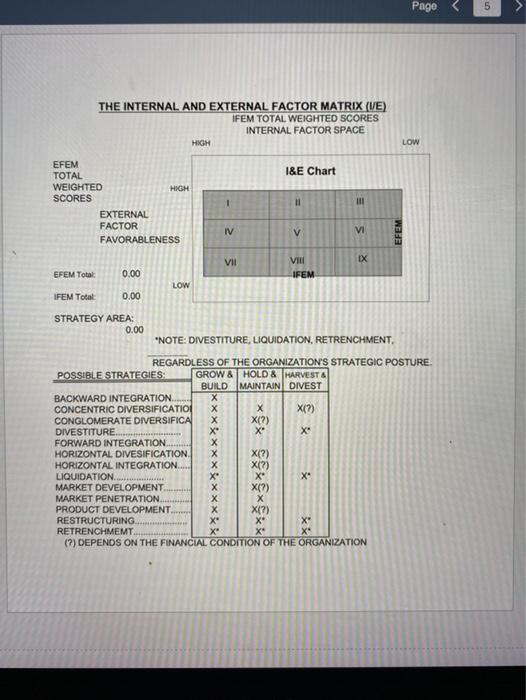
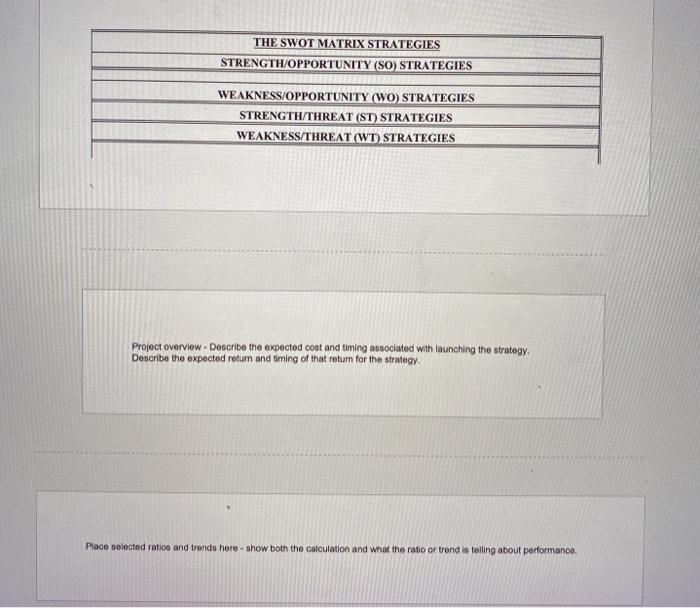
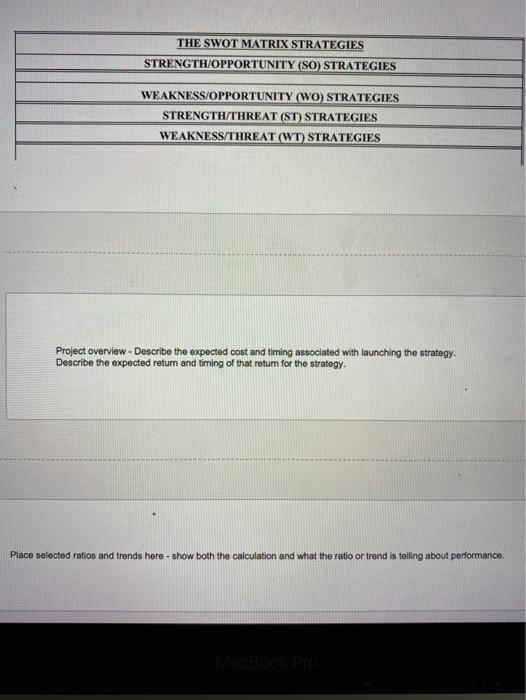
Q-SWOT The study of Business Analysis and Decision Making requires one to be thoughtful and organized. This spreadsheet is meant to be used as a tool to assist you with organizing the information presented to you in various cases. The process of listing, ranking and classifying the internal and external factors for any particular business is the first step to understanding the current effectiveness of the business strategy, and a guide for the decisions that need to be made in the future. Begin by listing the internal factors on the Internal tab (below) and the external factors on the external tab. Follow the instructions on each of the tabs. Do not add or delete columns or rows - use those that are provided. Don't modify the formulas that exist in the spreadsheet. Next, move to the SWOT tab and click the button that says "sort". Next, move to the "I&E Matrix". If the appears in cells I, II or IV - Grow and Build Internal is strong, and external is primarily one of opportunity. If the appears in cells VII, V or III -Hold and Maintain. Moderate to average both internally and externally. If the appears in cells VIII, IX or VI - Harvest and Divest. Company is predominantly weak, and external environment is mostly threats. Keep in mind that these are only suggestions, and are based on your own list of factors, your weights and your ratings Next, move on to the Strategies tab. Create potential strategies by making combinations from the SWOT page. Use these combinations: Strength and opportunity Strength and threat weakness and opportunity weakness and threat Next, on the Strategy - Summary page, briefly describe the cost and ROI of your strategy, including when the cost and return will be realized. Next, show your work regarding financial analysis - show both the caclulations and the explanation of what the analysis is telling you. Lastly, construct both your pro forma income statement and balance sheets on the tabs shown. Add tabs if necessary. Internal Factor Evaluation Internal Key Factors Total Rate 1.4 Weight .01 - .99 Total Weight must equal 1.0 - Intemal 1.0 - 2.0 2.0 - 3.0 3.0 - 4.0 otal FACTOR RATING SCALE 1. Major Weakness 3. Minor Strength 2. Minor Weakness 4. Major Strength Factor Weighting Scale - 0.01 = Low importance 0.99 = High importance All Factor Weights must sum to 1.0. INTERNAL FACTOR CODE: FN = FINANCE MG = MANAGEMENT MK = MARKETING IS = INFORMATION SYSTEMS PR = PRODUCTION OF A PRODUCT RD = RESEARCH AND DEVELOPMENT SV = THE PROVIDING OF A SERVICE Internal Score Analysis 1.0 - 2.0 - Weak internal structure and execution. 2.0 - 3.0 = Moderate to Average internal strength is seen in the in the analysis of the t 3.0 - 4.0 = Internal factors are primarily very strong and can be used to advantage ove External Factor Evaluation External Key Factors Rate Total Weight 01.99 FACTOR RATING SCALE 1. Major Threat 3. Minor Opportunity 2. Minor Threat 4 Maar oportunity Factor Wege 0.01 w importance 0.00 Nigh more EXTERNAL FACTOR CODE CP COMPETITIVE CL-CULTURAL OM DEMOGRAPHIC EC-ECONOMIC OE-GEOGRAPHIC ov-GOVERNMENT IN INDUSTRY LO LEGAL PL POLITICAL SC SOCIAL TO TECHNOLOGICAL To We must Encore Analysis 10m environment is not ending Wire 20-30 External environment is average and may contain pockets of opportunity 0.0 malorum loaded with oportuna External Factor Evaluation External Key Factors Rate Total Weight .01 - 99 Total Weight must equal 1.0 = External 1.0 - 2.0 2.0 - 3.0 3.0.4.0 Total ht -99 FACTOR RATING SCALE 1. Major Threat 3. Minor Opportunity 2. Minor Threat 4. Major Opportunity Factor Weight Scale -0.01 = low importance 0.99 = high importance EXTERNAL FACTOR CODE: CP =COMPETITIVE CL = CULTURAL DM = DEMOGRAPHIC EC = ECONOMIC GE = GEOGRAPHIC GV = GOVERNMENT IN = INDUSTRY LG = LEGAL PL = POLITICAL SC = SOCIAL TC = TECHNOLOGICAL External Score Analysis 1.0 - 2.0 = External environment is hostile and threatening. Will require definsive stratex 2.0-3.0 = External environment is average and may contain pockets of opportunity 3.0 - 4.0 = External environment is primarily loaded with opportunity SWOT STRENGTHS (S) Rating Weight WEAKNESSES (W) Rating, Wolah 9 10 10 12 13 12 13 14 15 16 17 18 19 15 16 17 18 19 OPPORTUNITIES (O) Rating Weight THREATS (U) Rating Weight 9 10 18 12 10 11 13 14 15 10 17 18 19 10 17 18 10 Page 5 THE INTERNAL AND EXTERNAL FACTOR MATRIX (VE) IFEM TOTAL WEIGHTED SCORES INTERNAL FACTOR SPACE HIGH LOW I&E Chart EFEM TOTAL WEIGHTED HIGH SCORES EXTERNAL FACTOR FAVORABLENESS HI 11 IV 5 v EFEM VII EX VIII IFEM EFEM Total: 0.00 LOW IFEM Total 0.00 STRATEGY AREA: 0.00 "NOTE: DIVESTITURE, LIQUIDATION, RETRENCHMENT, REGARDLESS OF THE ORGANIZATION'S STRATEGIC POSTURE. POSSIBLE STRATEGIES: GROW & HOLD & HARVEST & BUILD MAINTAIN DIVEST BACKWARD INTEGRATION.... CONCENTRIC DIVERSIFICATION X(?) CONGLOMERATE DIVERSIFICA X(?) DIVESTITURE X* X X FORWARD INTEGRATION... HORIZONTAL DIVESIFICATION X(?) HORIZONTAL INTEGRATION X(?) LIQUIDATION......... X MARKET DEVELOPMENT X(?) MARKET PENETRATION PRODUCT DEVELOPMENT X(?) RESTRUCTURING X X* X RETRENCHMEMT X X* (7) DEPENDS ON THE FINANCIAL CONDITION OF THE ORGANIZATION x THE SWOT MATRIX STRATEGIES STRENGTH/OPPORTUNITY (SO) STRATEGIES WEAKNESS/OPPORTUNITY (WO) STRATEGIES STRENGTH/THREAT (ST) STRATEGIES WEAKNESS/THREAT (WT) STRATEGIES Project overview - Describe the expected cost and timing associated with launching the strategy Describe the expected return and timing of that return for the strategy Place selected ratios and trends here. show both the calculation and what the ratio or trend is telling about performance THE SWOT MATRIX STRATEGIES STRENGTH/OPPORTUNITY (SO) STRATEGIES WEAKNESS OPPORTUNITY (WO) STRATEGIES STRENGTH/THREAT (ST) STRATEGIES WEAKNESS/THREAT (WT) STRATEGIES Project Overview - Describe the expected cost and timing associated with launching the strategy Describe the expected return and timing of that return for the strategy Place selected ratios and trends here - show both the calculation and what the ratio or trend is telling about performance
Step by Step Solution
There are 3 Steps involved in it
1 Expert Approved Answer
Step: 1 Unlock

Question Has Been Solved by an Expert!
Get step-by-step solutions from verified subject matter experts
Step: 2 Unlock
Step: 3 Unlock