

Question: Create a R script or R markdown file. # read the 'HousePrice.csv ' , load it to a dataframe. house 2 read.csv ( ' HousePrice
Create a R script or R markdown file.
# read the 'HousePrice.csv load it to a dataframe.
house read.csvHousePricecsv
# convert continuous house price values to labels
house$Pricefactorwithhouse ifelsehouse$Price 'low','high'
# check number of samples in each category
tablehouse$Price
# Divide as training and testing: test train and get the training
data size
samplesize floornrowhouse
# check the training data size
samplesize
# get train data index
trainind sampleseqlennrowhouse size samplesize
# generate training and test dataset
train housetrainind,
test housetrainind,
# use glm to build logistic model
glmfit glmPrice SqftAreaLotAreaAgeCrime, data train,
family binomial
summaryglmfit
data train
Coefficients:
Null deviance: on degrees of freedam Residual deviance: on degrees of freedom observatians deleted due to missingness AIC:
# predict on test dataset
predictedprob predictglmfit, newdata test, type "response"
headpredictedprob
# check the probability
newdata data.frametest$SqftArea, test$Price, predictedprob
headnewdata
ggplotnewdataaesxtest.SqftArea, ypredictedprob geompoint
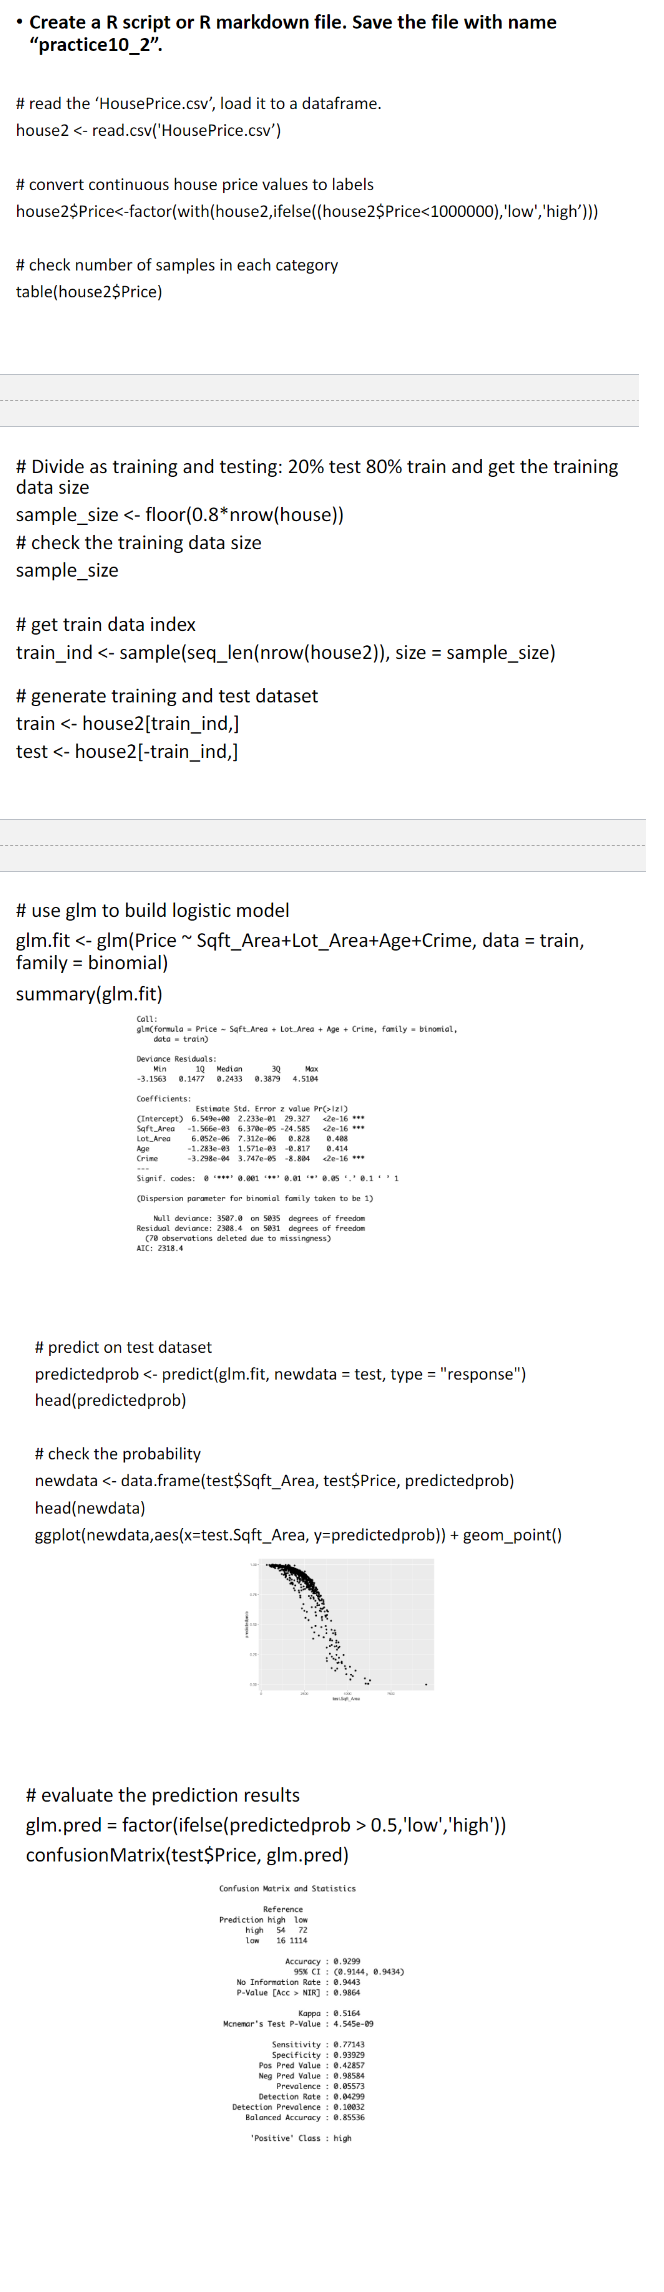
# evaluate the prediction results
glmpred factorifelsepredictedprob 'low','high'
confusionMatrixtest$Price, glmpred
Step by Step Solution
There are 3 Steps involved in it
1 Expert Approved Answer
Step: 1 Unlock

Question Has Been Solved by an Expert!
Get step-by-step solutions from verified subject matter experts
Step: 2 Unlock
Step: 3 Unlock