

Question: Create a report page that can analyze data in various forms such as weekly, monthly, and quarterly using the pivot table function The comprehensive stock
Create a report page that can analyze data in various forms such as weekly, monthly, and quarterly using the pivot table function
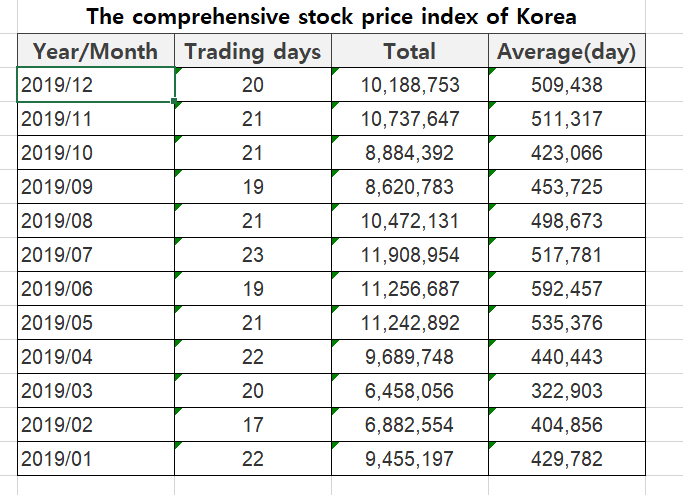
The comprehensive stock price index of Korea Year/Month Trading days Total Average(day) 2019/12 20 10,188,753 509,438 2019/11 21 10,737,647 511,317 2019/10 21 8,884,392 423,066 2019/09 19 8,620,783 453,725 2019/08 21 10,472,131 498,673 2019/07 23 11,908,954 517,781 2019/06 19 11,256,687 592,457 2019/05 21 11,242,892 535,376 2019/04 22 9,689,748 440,443 2019/03 20 6,458,056 322,903 2019/02 17 6,882,554 404,856 2019/01 22 9,455,197 429,782 The comprehensive stock price index of Korea Year/Month Trading days Total Average(day) 2019/12 20 10,188,753 509,438 2019/11 21 10,737,647 511,317 2019/10 21 8,884,392 423,066 2019/09 19 8,620,783 453,725 2019/08 21 10,472,131 498,673 2019/07 23 11,908,954 517,781 2019/06 19 11,256,687 592,457 2019/05 21 11,242,892 535,376 2019/04 22 9,689,748 440,443 2019/03 20 6,458,056 322,903 2019/02 17 6,882,554 404,856 2019/01 22 9,455,197 429,782
Step by Step Solution
There are 3 Steps involved in it

Get step-by-step solutions from verified subject matter experts