

Question: Create a residual plot based of of graph shown The graph shows a bivariate data set and its least squares regression line. y 4 1
Create a residual plot based of of graph shown
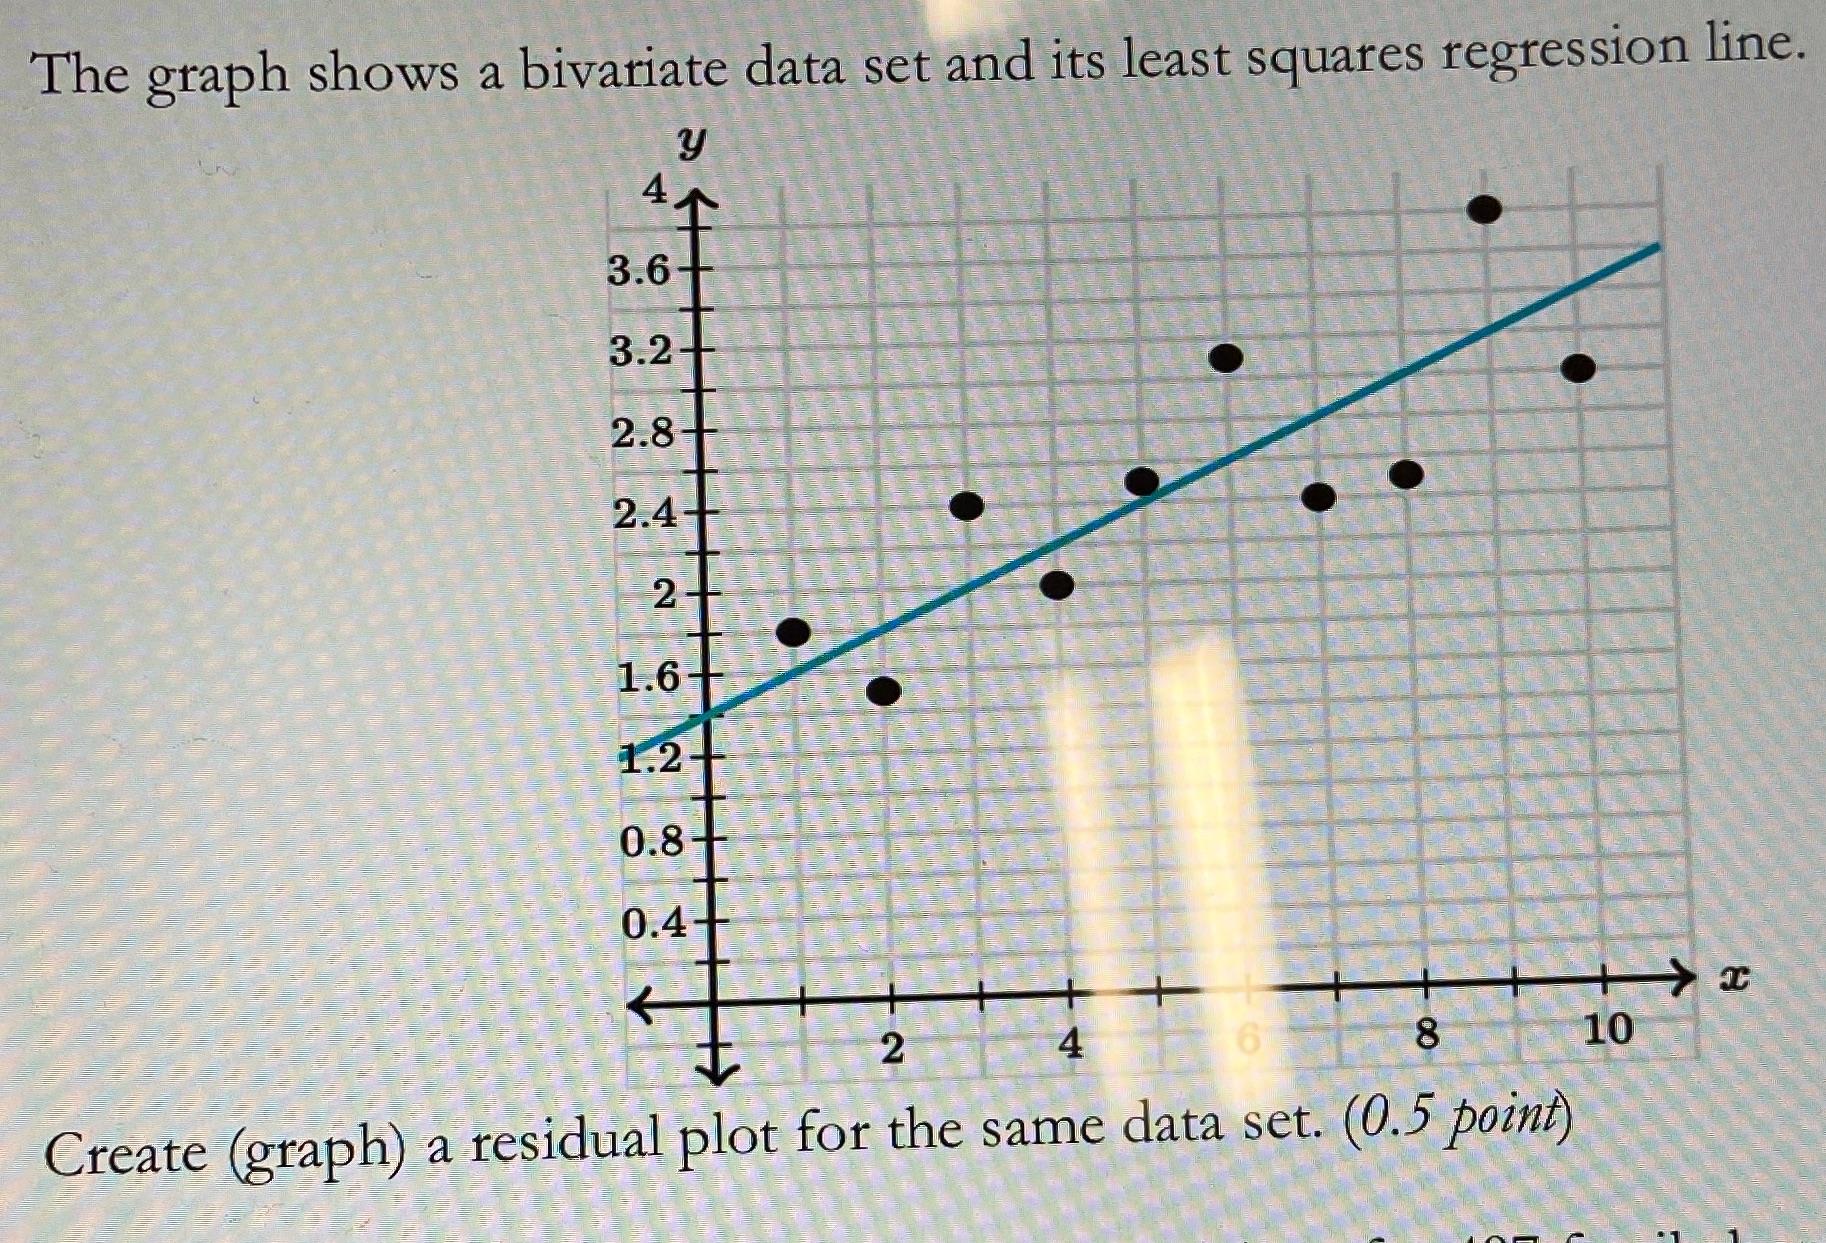
The graph shows a bivariate data set and its least squares regression line. y 4 1 3.6 3.2 2.8 2.4 2 1.6- 1.2- 0.8 0.4 8 10 Create (graph) a residual plot for the same data set. (0.5 point)
Step by Step Solution
There are 3 Steps involved in it
1 Expert Approved Answer
Step: 1 Unlock

Question Has Been Solved by an Expert!
Get step-by-step solutions from verified subject matter experts
Step: 2 Unlock
Step: 3 Unlock