

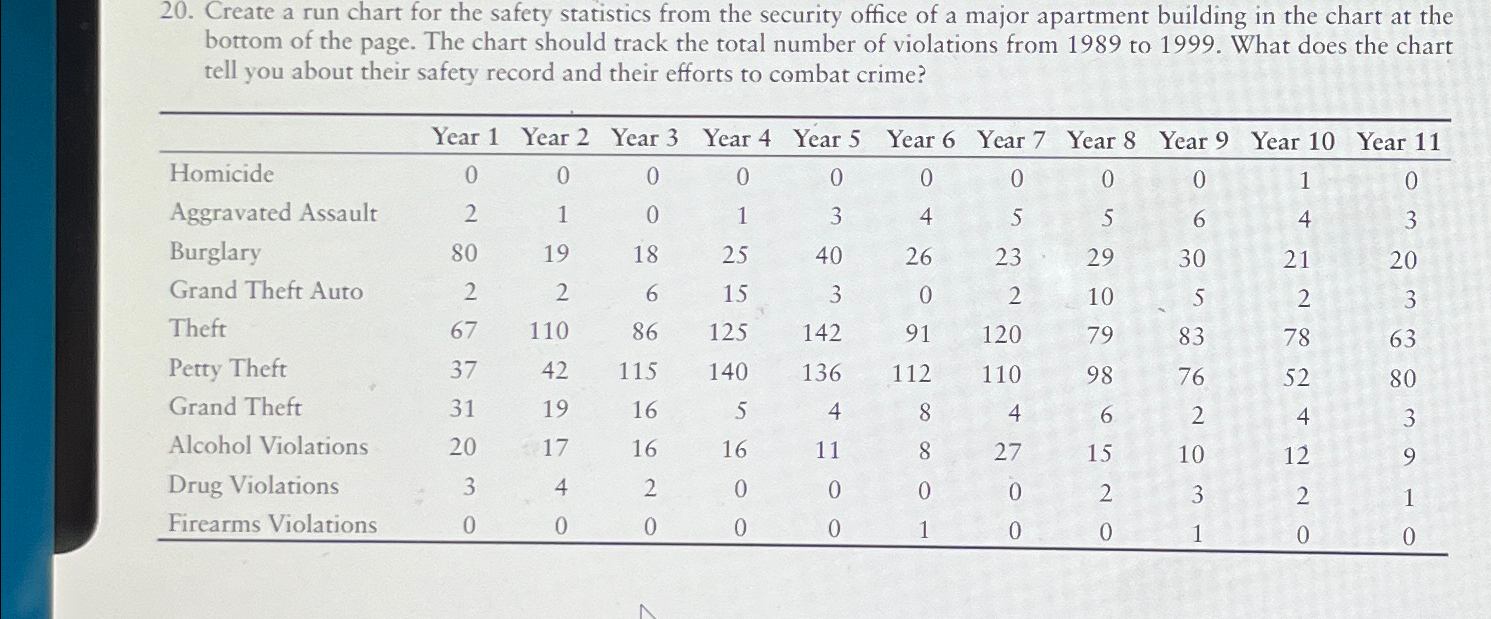
Question: Create a run chart for the safety statistics from the security office of a major apartment building in the chart at the bottom of the
Create a run chart for the safety statistics from the security office of a major apartment building in the chart at the bottom of the page. The chart should track the total number of violations from to What does the chart tell you about their safety record and their efforts to combat crime?
tableYear Year Year Year Year Year Year Year Year Year Year HomicideAggravated Assault,BurglaryGrand Theft Auto,TheftPetty Theft,Grand Theft,Alcohol Violations,Drug Violations,Firearms Violations,
Step by Step Solution
There are 3 Steps involved in it
1 Expert Approved Answer
Step: 1 Unlock

Question Has Been Solved by an Expert!
Get step-by-step solutions from verified subject matter experts
Step: 2 Unlock
Step: 3 Unlock