

Question: Create a scatter chart to examine the relationship between the year released and the inflation-adjusted U.S. box-office receipts. Include a trendline for this scatter chart.
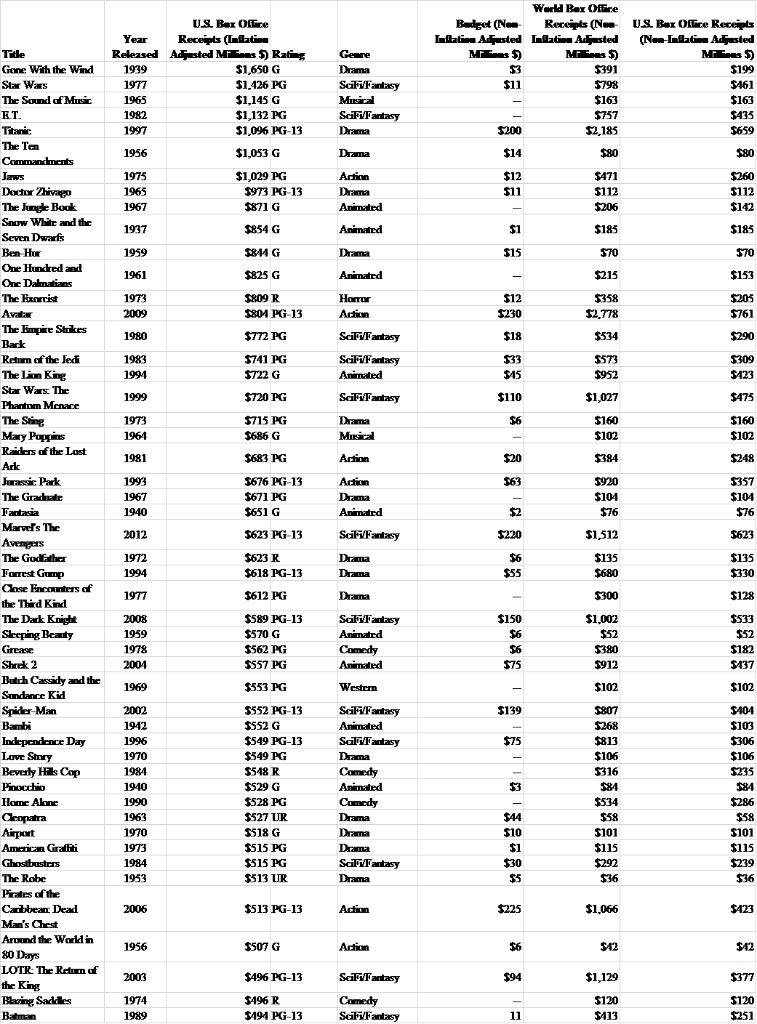
Create a scatter chart to examine the relationship between the year released and the inflation-adjusted U.S. box-office receipts. Include a trendline for this scatter chart. What does the scatter chart indicate about inflation-adjusted U.S. box-office receipts over time for these top 50 movies?. Explain step by step how to make the scatter chart in excel.
Step by Step Solution
There are 3 Steps involved in it
1 Expert Approved Answer
Step: 1 Unlock

Question Has Been Solved by an Expert!
Get step-by-step solutions from verified subject matter experts
Step: 2 Unlock
Step: 3 Unlock